
















Copyright: ©Author(s) 2026.
World J Clin Cases. Mar 16, 2026; 14(8): 118582
Published online Mar 16, 2026. doi: 10.12998/wjcc.v14.i8.118582
Published online Mar 16, 2026. doi: 10.12998/wjcc.v14.i8.118582
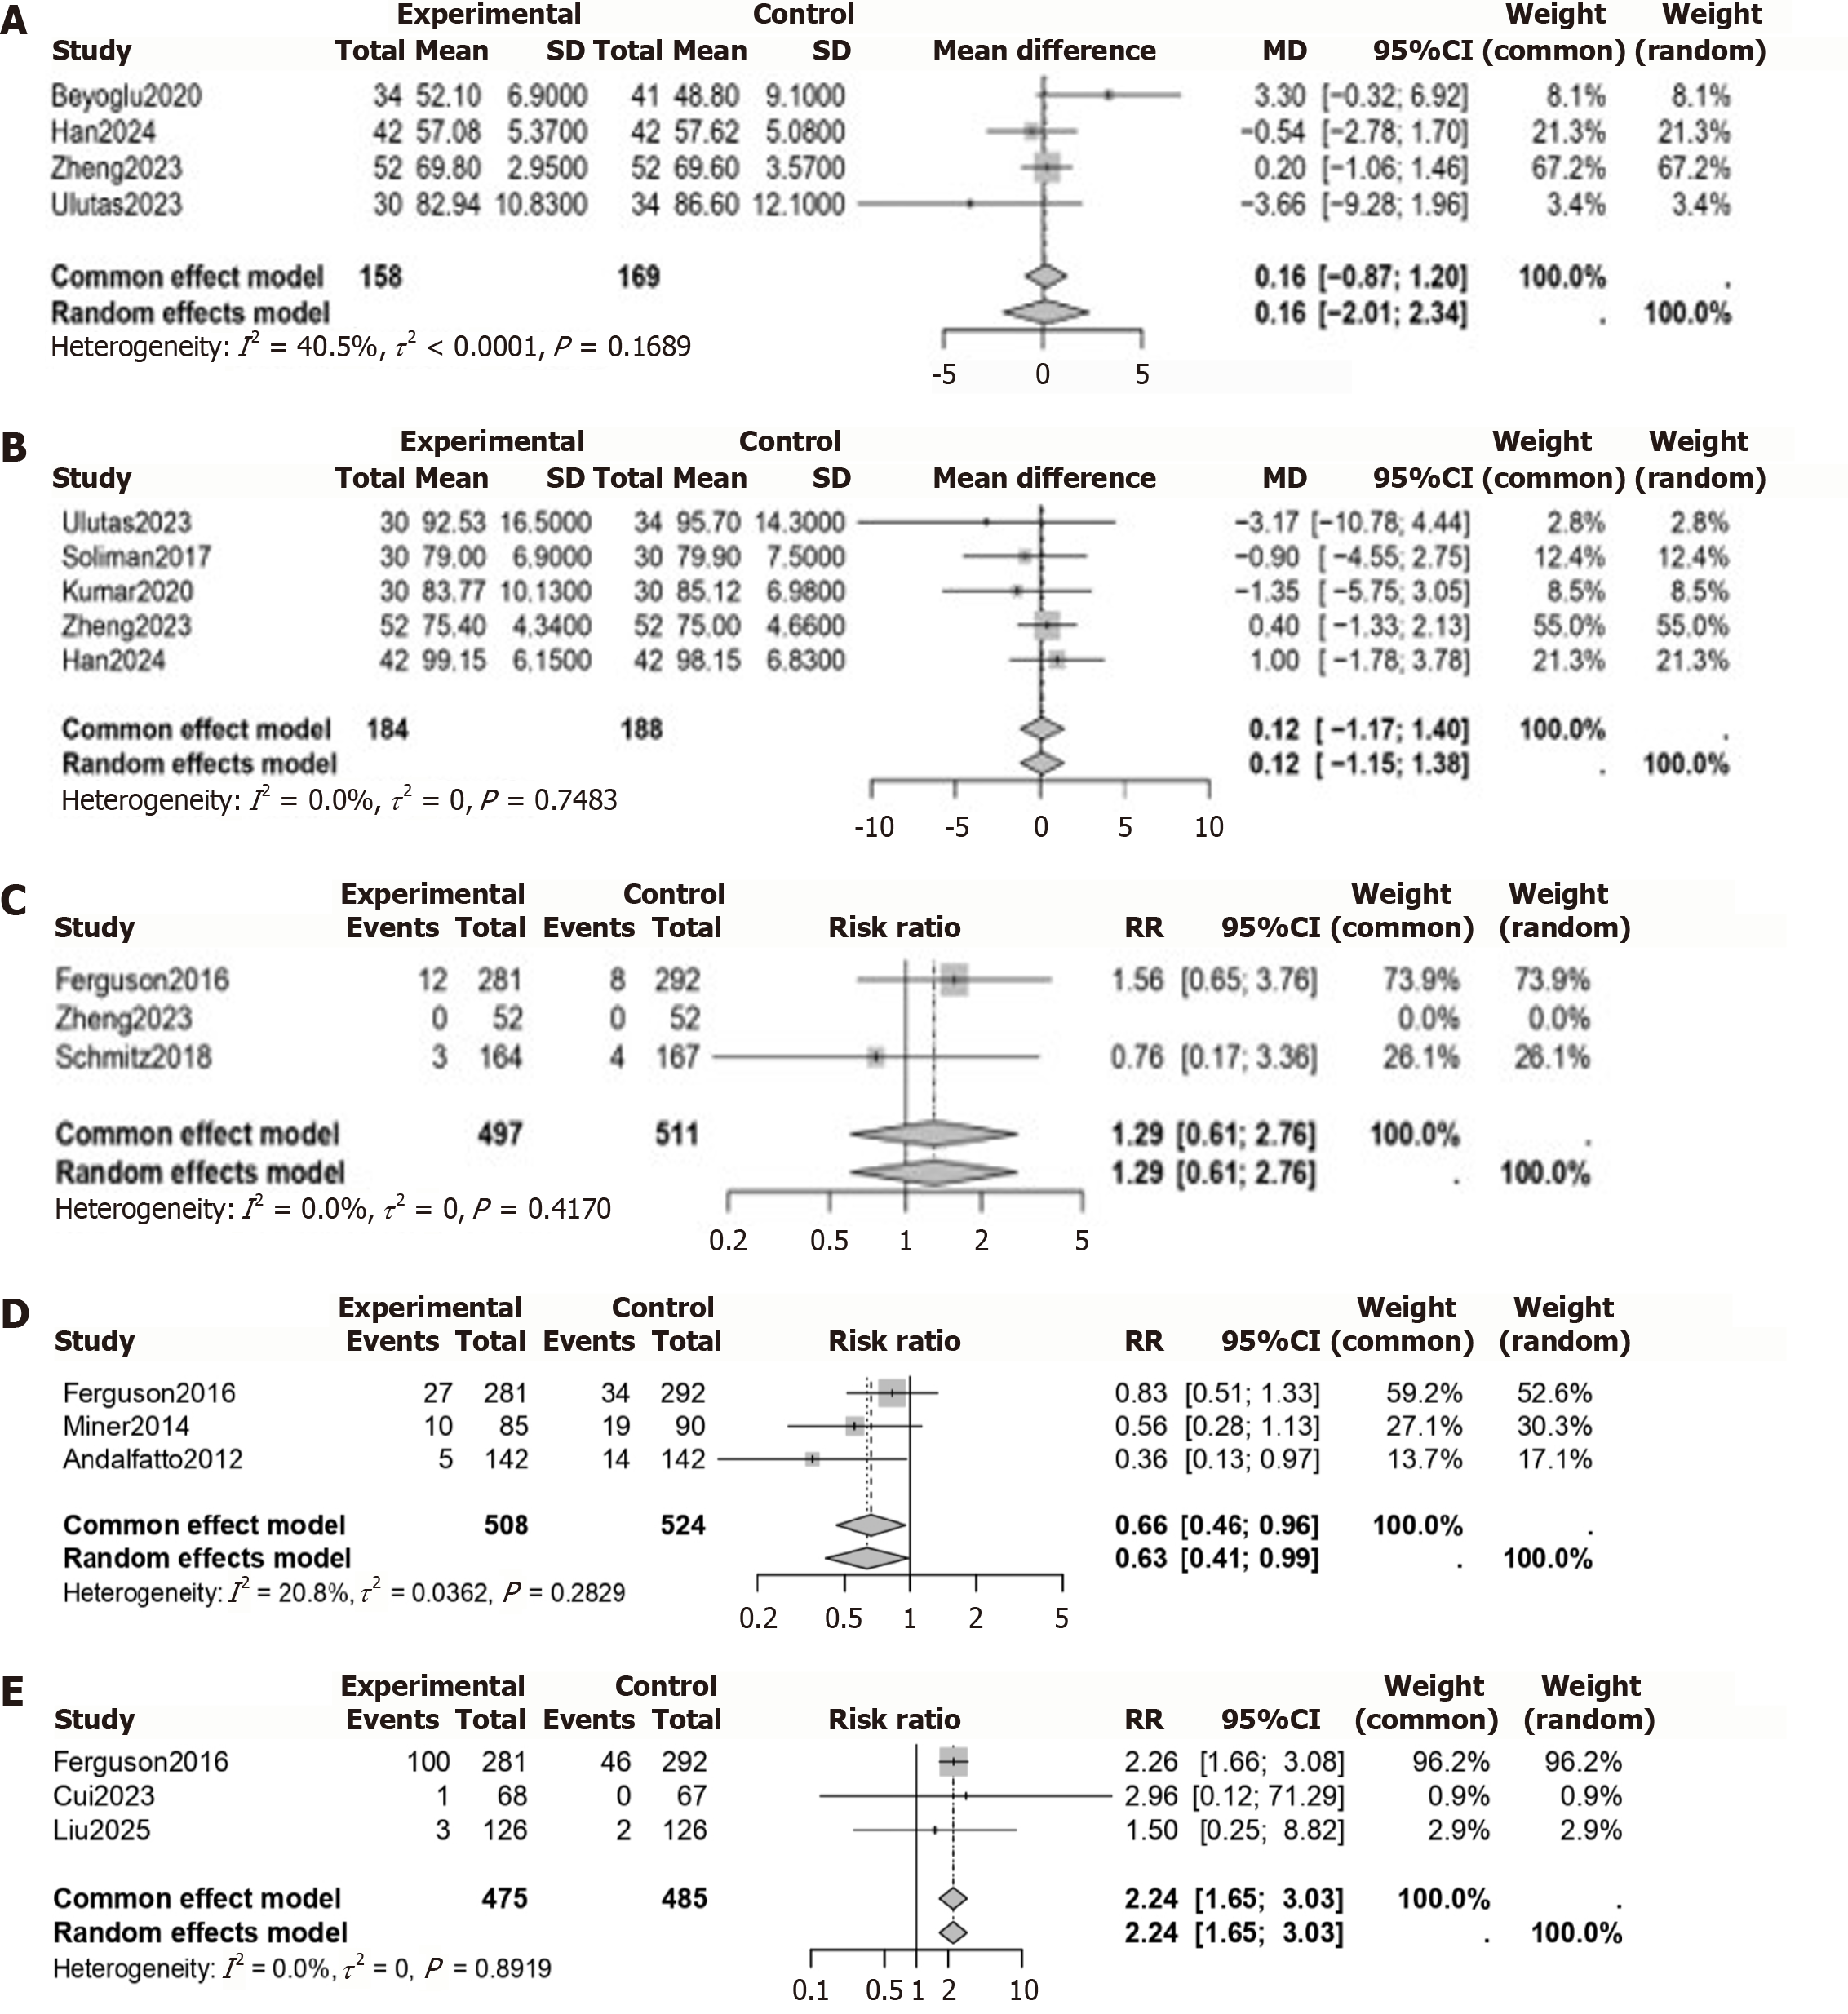
Figure 4 Forest plots of secondary outcomes.
A: Mean difference (MD) in diastolic blood pressure; B: MD in heart rate; C: Risk ratio (RR) for vomiting; D: RR for airway events; E: RR for hallucinations. CI: Confidence interval.
- Citation: Faheem MSB, Hassan ST, Feroze F, Khan A, Munir SU, Khaliq A, Fatima ST, Mendonca R, Surani S. Combination of N-methyl-D-aspartate receptor antagonists and propofol for procedural sedation. World J Clin Cases 2026; 14(8): 118582
- URL: https://www.wjgnet.com/2307-8960/full/v14/i8/118582.htm
- DOI: https://dx.doi.org/10.12998/wjcc.v14.i8.118582