
















©The Author(s) 2026.
World J Clin Cases. Feb 6, 2026; 14(4): 117700
Published online Feb 6, 2026. doi: 10.12998/wjcc.v14.i4.117700
Published online Feb 6, 2026. doi: 10.12998/wjcc.v14.i4.117700
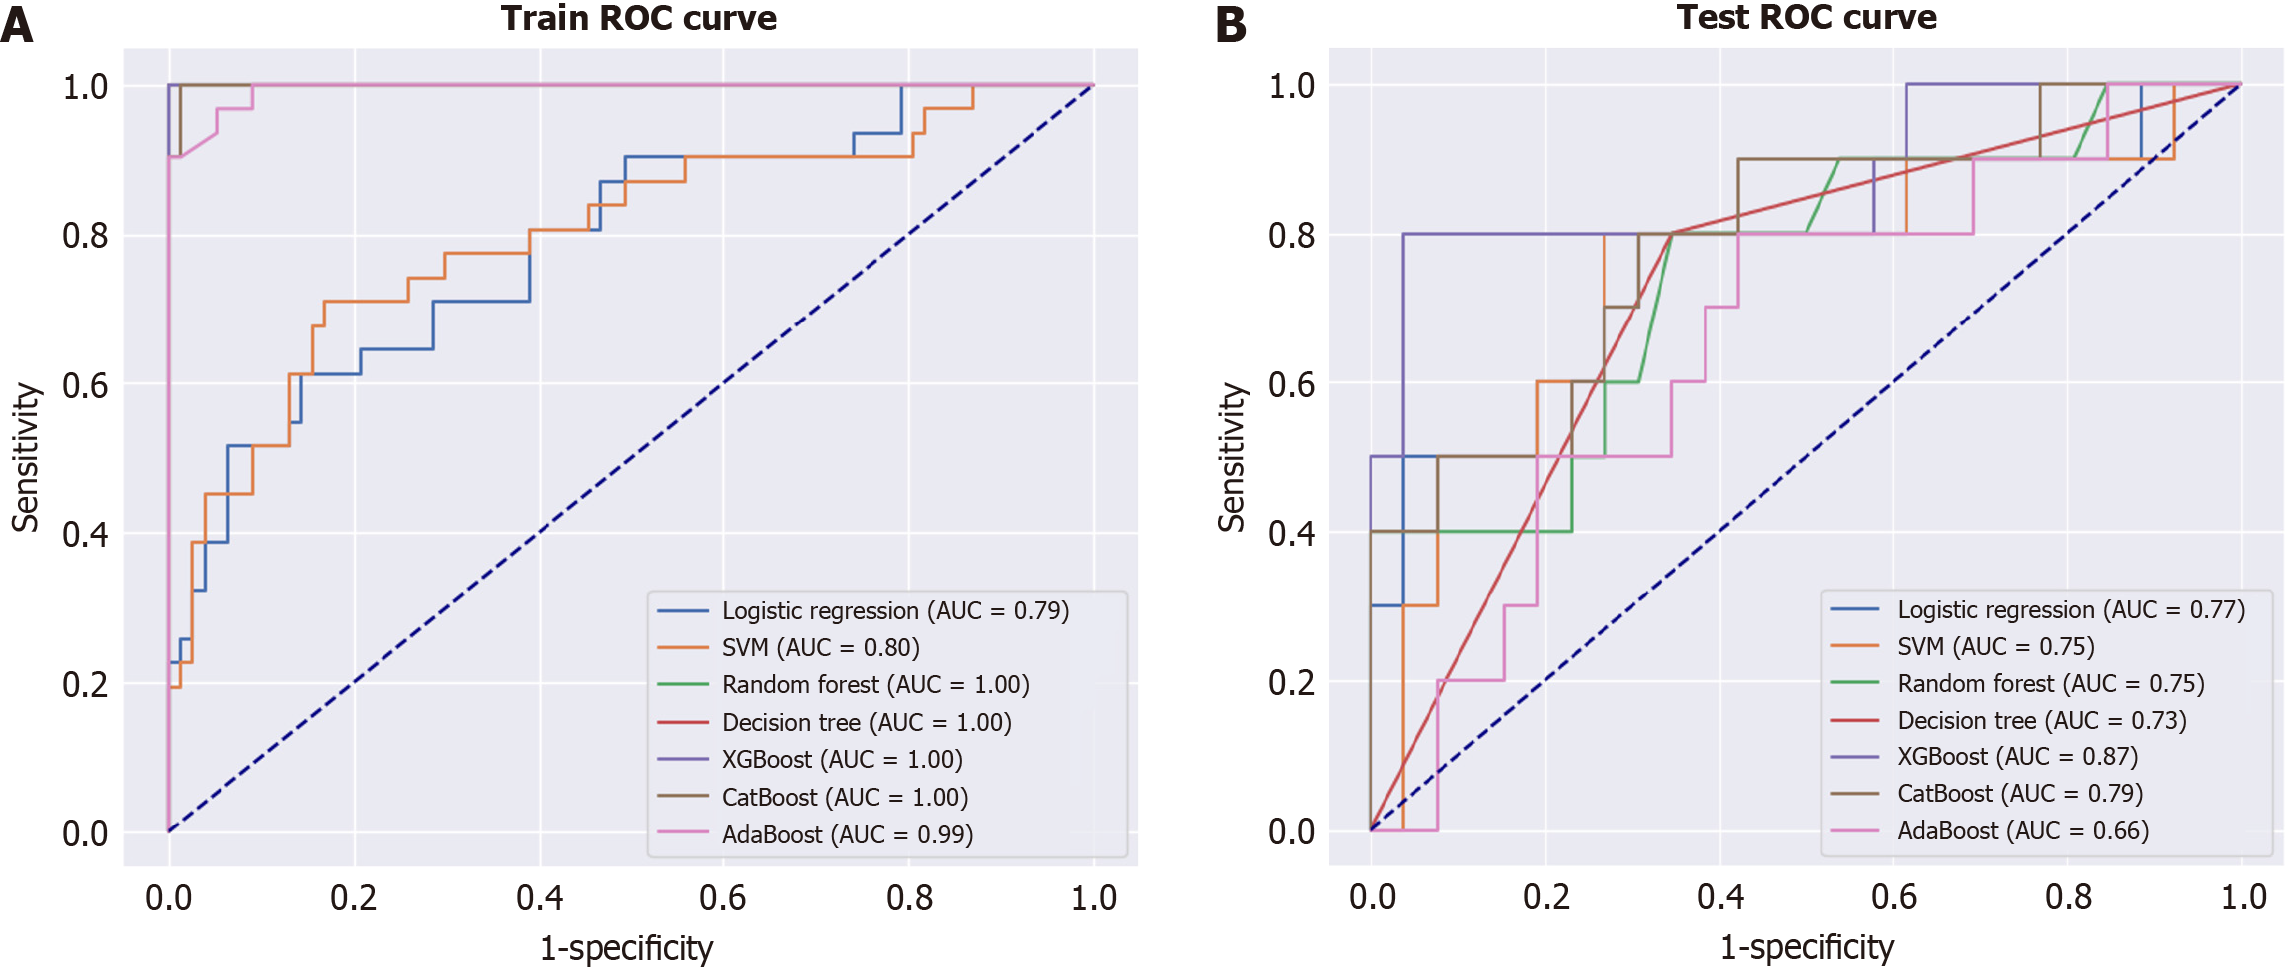
Figure 5 SHapley Additive exPlanations analysis of the extreme gradient boosting model.
A and B: SHapley Additive exPlanations (SHAP) values were calculated for the extreme gradient boosting model model to reveal the influence of individual variables on predictions from the SHAP dependence plot (A), and SHAP beeswarm plot (B). Being female and having a slower preoperative walking speed were key factors affecting the model’s predictions of hospital-acquired functional decline. XGBoost: Extreme gradient boosting model; CatBoost: Category boosting model; AdaBoost: Adaptive boosting model; AUC: Area under the receiver operating characteristic curve; SVM: Support vector machine model; ROC: Receiver operating characteristic.
- Citation: Hiramatsu R, Imaoka S, Minata S, Sako H, Sato N. Machine learning model for predicting hospital-acquired functional decline in older patients with postoperative cardiovascular surgery. World J Clin Cases 2026; 14(4): 117700
- URL: https://www.wjgnet.com/2307-8960/full/v14/i4/117700.htm
- DOI: https://dx.doi.org/10.12998/wjcc.v14.i4.117700