
















©The Author(s) 2026.
World J Clin Cases. Feb 6, 2026; 14(4): 117700
Published online Feb 6, 2026. doi: 10.12998/wjcc.v14.i4.117700
Published online Feb 6, 2026. doi: 10.12998/wjcc.v14.i4.117700
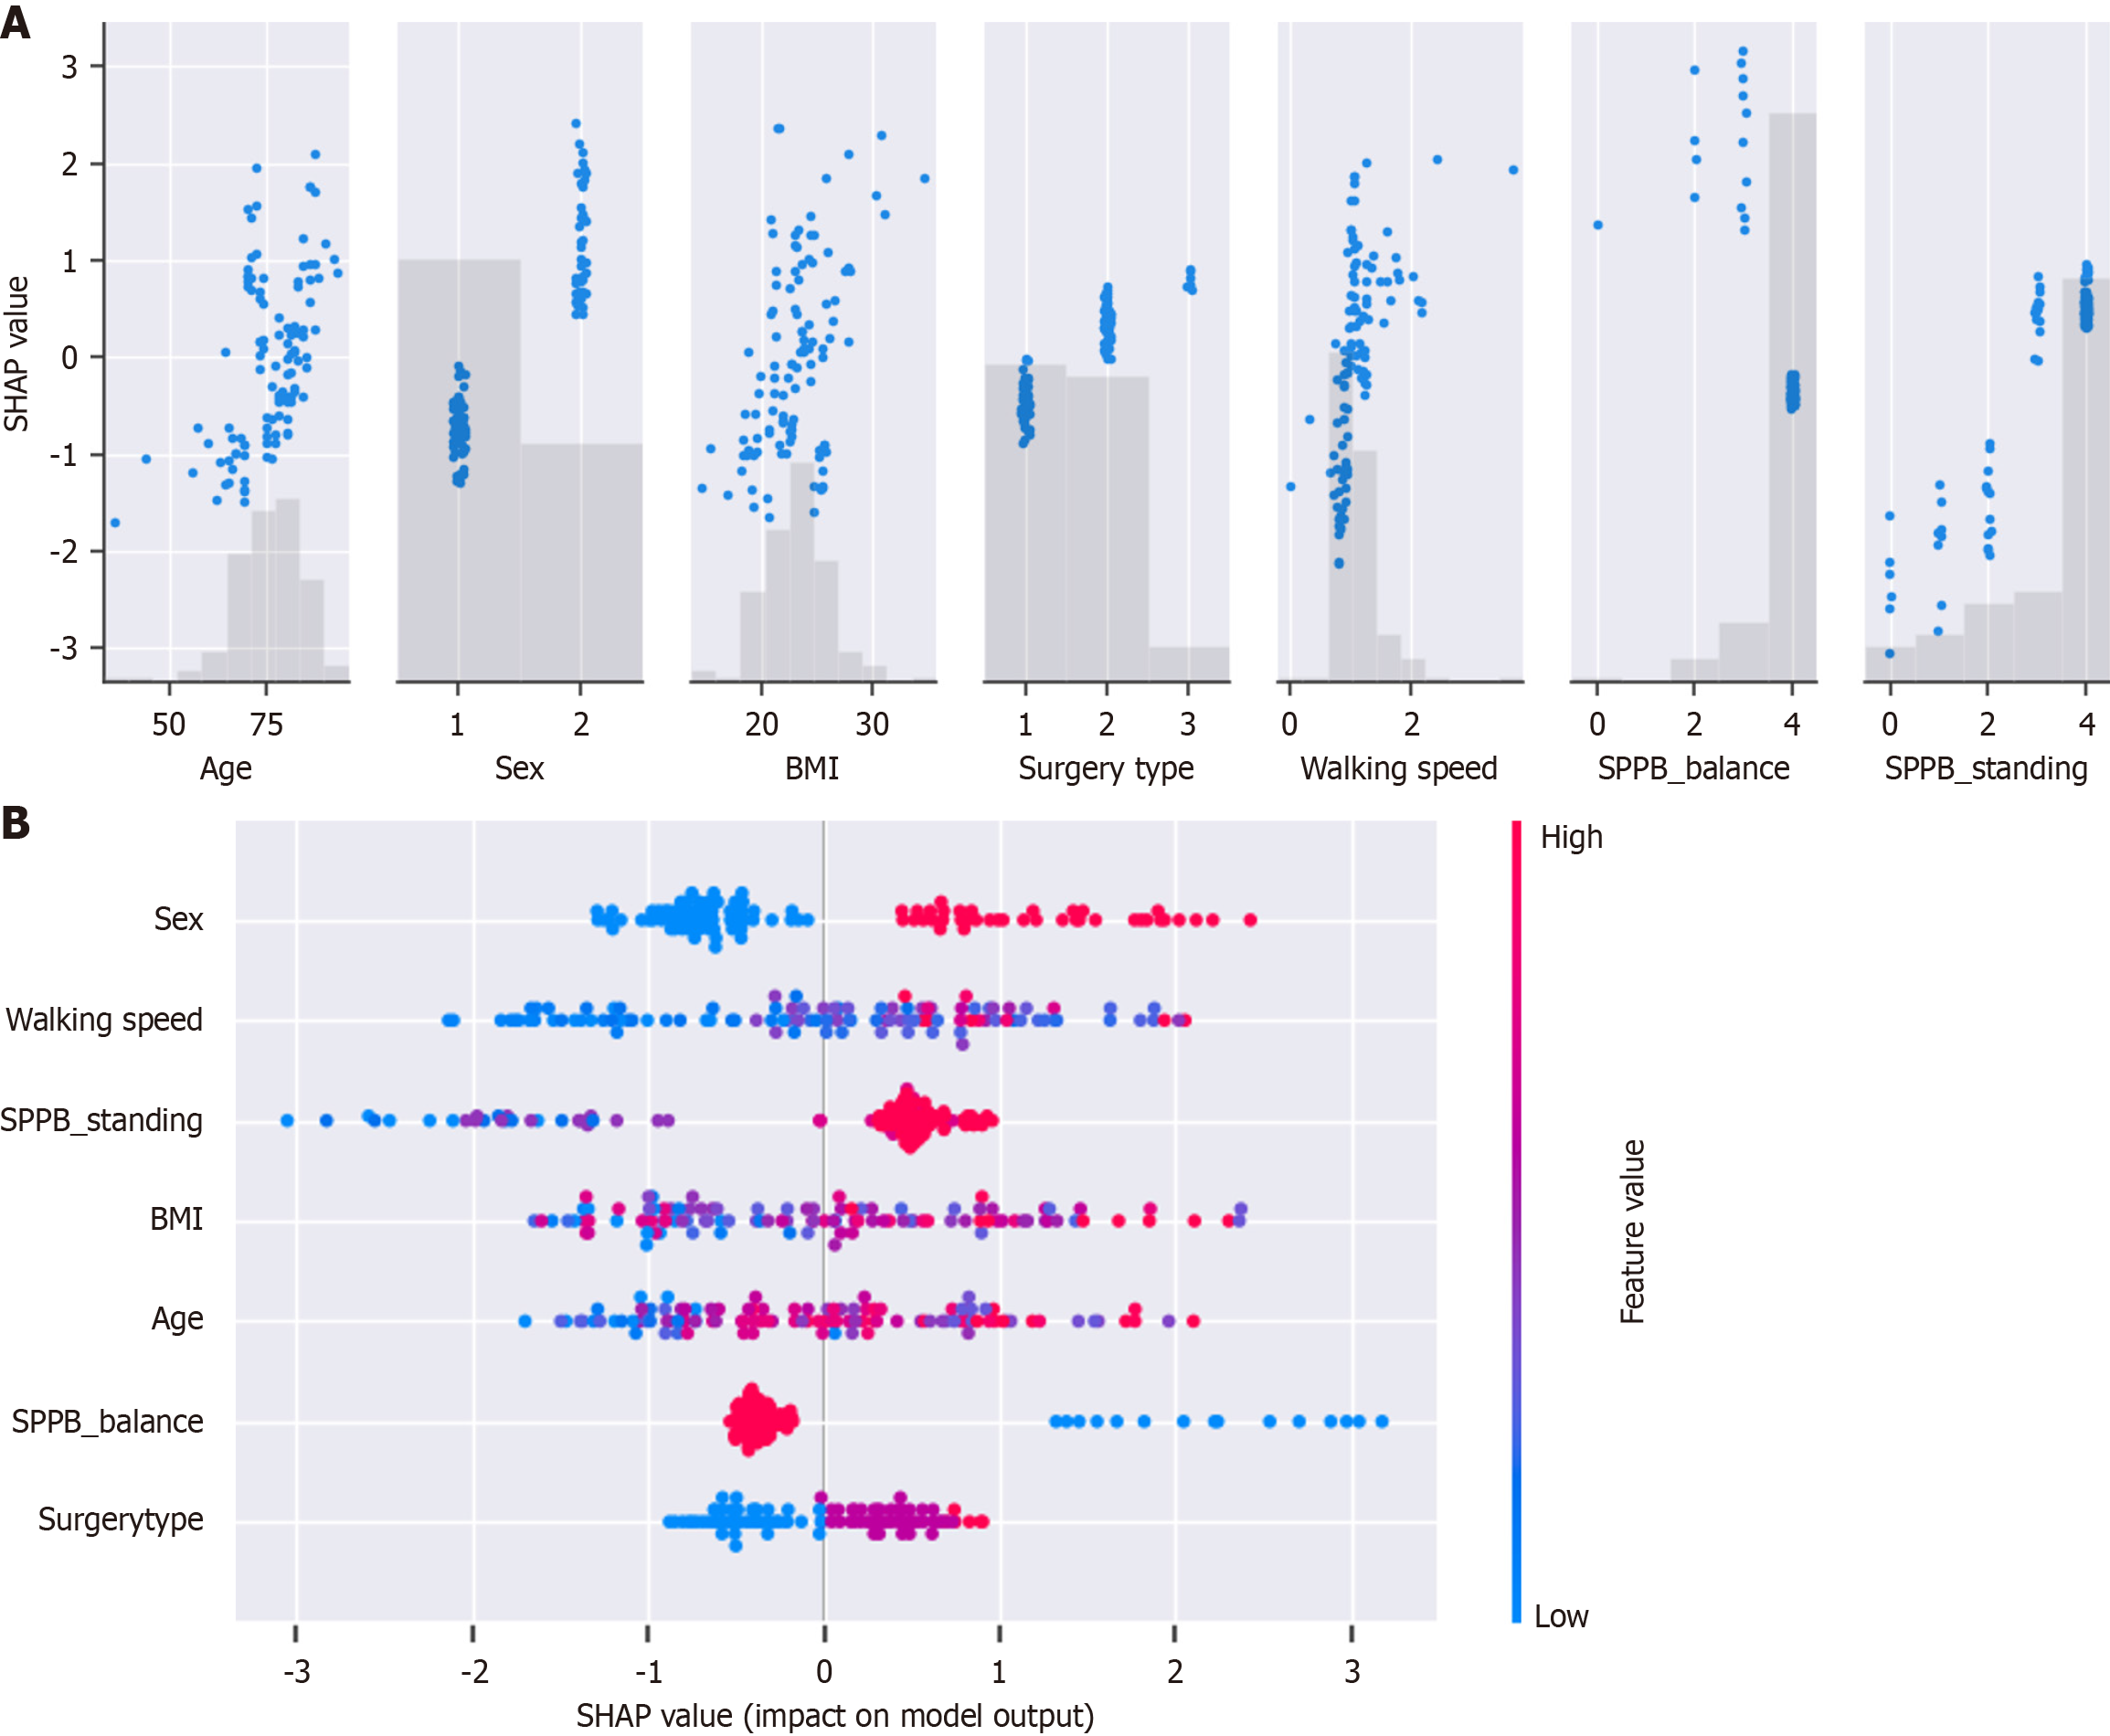
Figure 4 Predictive performance of the extreme gradient boosting model assessed using a receiver operating characteristic curve.
A: SHapley Additive exPlanations (SHAP) dependence plot; B: SHAP beeswarm plot. The extreme gradient boosting model (XGBoost) model performed the best for predicting hospital-acquired functional decline, achieving an area under the receiver operating characteristic curve value of 0.87. The XGBoost model is compared with other models. SPPB: Short physical performance battery; BMI: Body mass index.
- Citation: Hiramatsu R, Imaoka S, Minata S, Sako H, Sato N. Machine learning model for predicting hospital-acquired functional decline in older patients with postoperative cardiovascular surgery. World J Clin Cases 2026; 14(4): 117700
- URL: https://www.wjgnet.com/2307-8960/full/v14/i4/117700.htm
- DOI: https://dx.doi.org/10.12998/wjcc.v14.i4.117700