
















Copyright: ©Author(s) 2026.
World J Clin Cases. May 26, 2026; 14(15): 119781
Published online May 26, 2026. doi: 10.12998/wjcc.v14.i15.119781
Published online May 26, 2026. doi: 10.12998/wjcc.v14.i15.119781
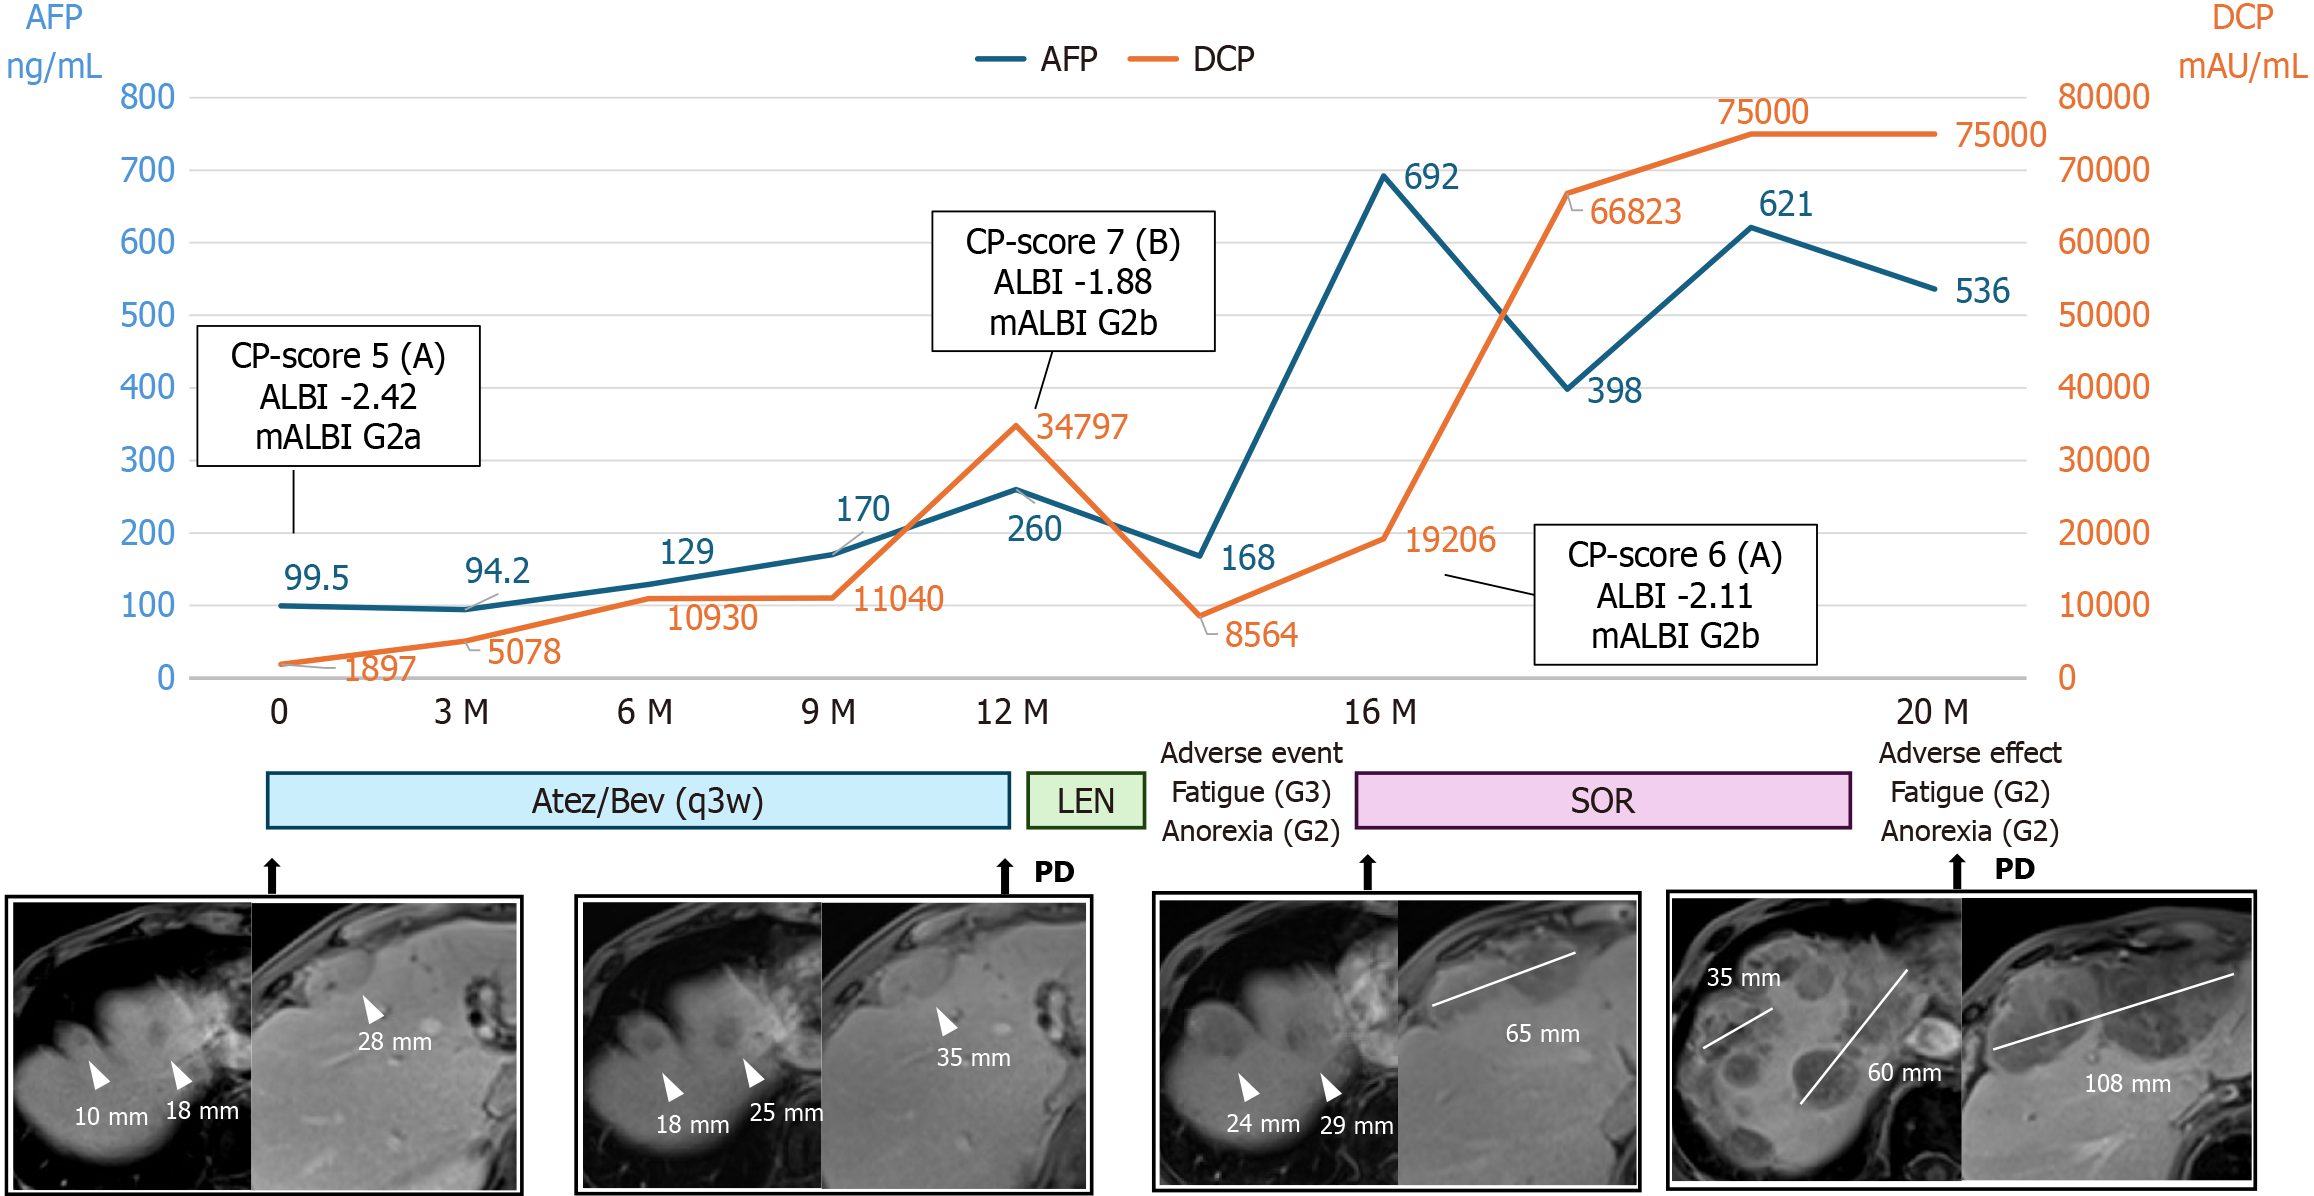
Figure 1 Progression chart based on tumor markers and magnetic resonance imaging findings.
Atezolizumab plus bevacizumab therapy (every 3 weeks) was administered for 12 months, and progressive disease (PD) was determined. Lenvatinib was discontinued after 3 weeks due to adverse events, and sorafenib was administered for 4 months but was discontinued because of adverse events and PD. The image shows the late phase of contrast-enhanced magnetic resonance imaging. The tumor gradually increased in size. Tumor response was evaluated according to the Response Evaluation Criteria in Solid Tumors version 1.1. The tumors are indicated by white arrowheads. The maximum tumor diameters are indicated by white lines, with the corresponding measurements (mm) shown. Atez/Bev: Atezolizumab plus bevacizumab; LEN: Lenvatinib; SOR: Sorafenib; PD: Progressive disease; q3w: Every 3 weeks; DCP: Des-gamma carboxyprothrombin; AFP: Alpha-fetoprotein; ALBI: Albumin-bilirubin.
- Citation: Fukushima M, Nakao Y, Sasaki R, Haraguchi M, Miuma S, Miyaaki H. Dramatic response to fourth-line ramucirumab after atezolizumab plus bevacizumab failure in advanced hepatocellular carcinoma: A case report. World J Clin Cases 2026; 14(15): 119781
- URL: https://www.wjgnet.com/2307-8960/full/v14/i15/119781.htm
- DOI: https://dx.doi.org/10.12998/wjcc.v14.i15.119781