
















Copyright: ©Author(s) 2026.
World J Clin Cases. May 26, 2026; 14(15): 118960
Published online May 26, 2026. doi: 10.12998/wjcc.v14.i15.118960
Published online May 26, 2026. doi: 10.12998/wjcc.v14.i15.118960
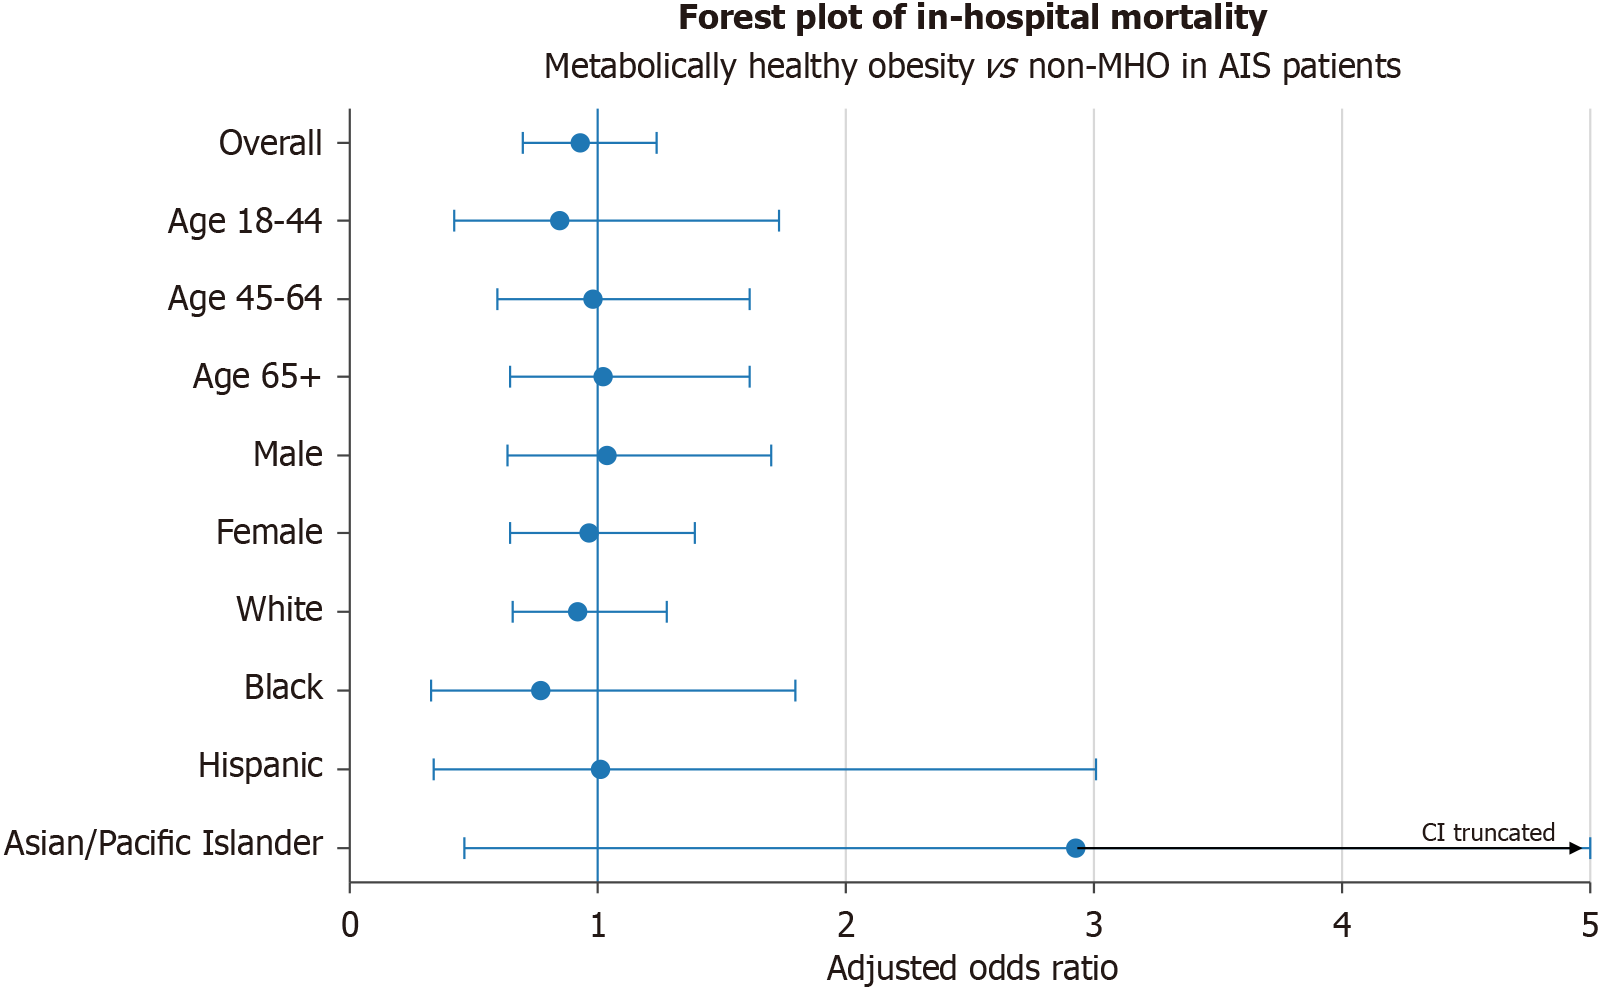
Figure 2 Forest plot showing adjusted odds ratios for in-hospital mortality in patients with acute ischemic stroke and metabolically healthy obesity compared with patients in the non-metabolically healthy obesity group, stratified by age, sex, and race/ethnicity.
The X-axis was truncated at 5 for readability; the confidence interval for the Asian/Pacific Islander subgroup extends beyond the plotted range. AIS: Acute ischemic stroke; MHO: Metabolically healthy obesity; CI: Confidence interval.
- Citation: Mohammed AS, Desai R, Manne S, Gogikar A, Reddy Tera C, Oble MJP, Nair A, Nawab S, Polamarasetty H, Srivastava AA, Chiluka S, Eppalapally AK, Reddy SSK. Burden and impact of metabolically healthy obesity on in-hospital outcomes of acute ischemic stroke: A nationwide study. World J Clin Cases 2026; 14(15): 118960
- URL: https://www.wjgnet.com/2307-8960/full/v14/i15/118960.htm
- DOI: https://dx.doi.org/10.12998/wjcc.v14.i15.118960