
















Copyright: ©Author(s) 2026.
World J Clin Cases. May 6, 2026; 14(13): 119563
Published online May 6, 2026. doi: 10.12998/wjcc.v14.i13.119563
Published online May 6, 2026. doi: 10.12998/wjcc.v14.i13.119563
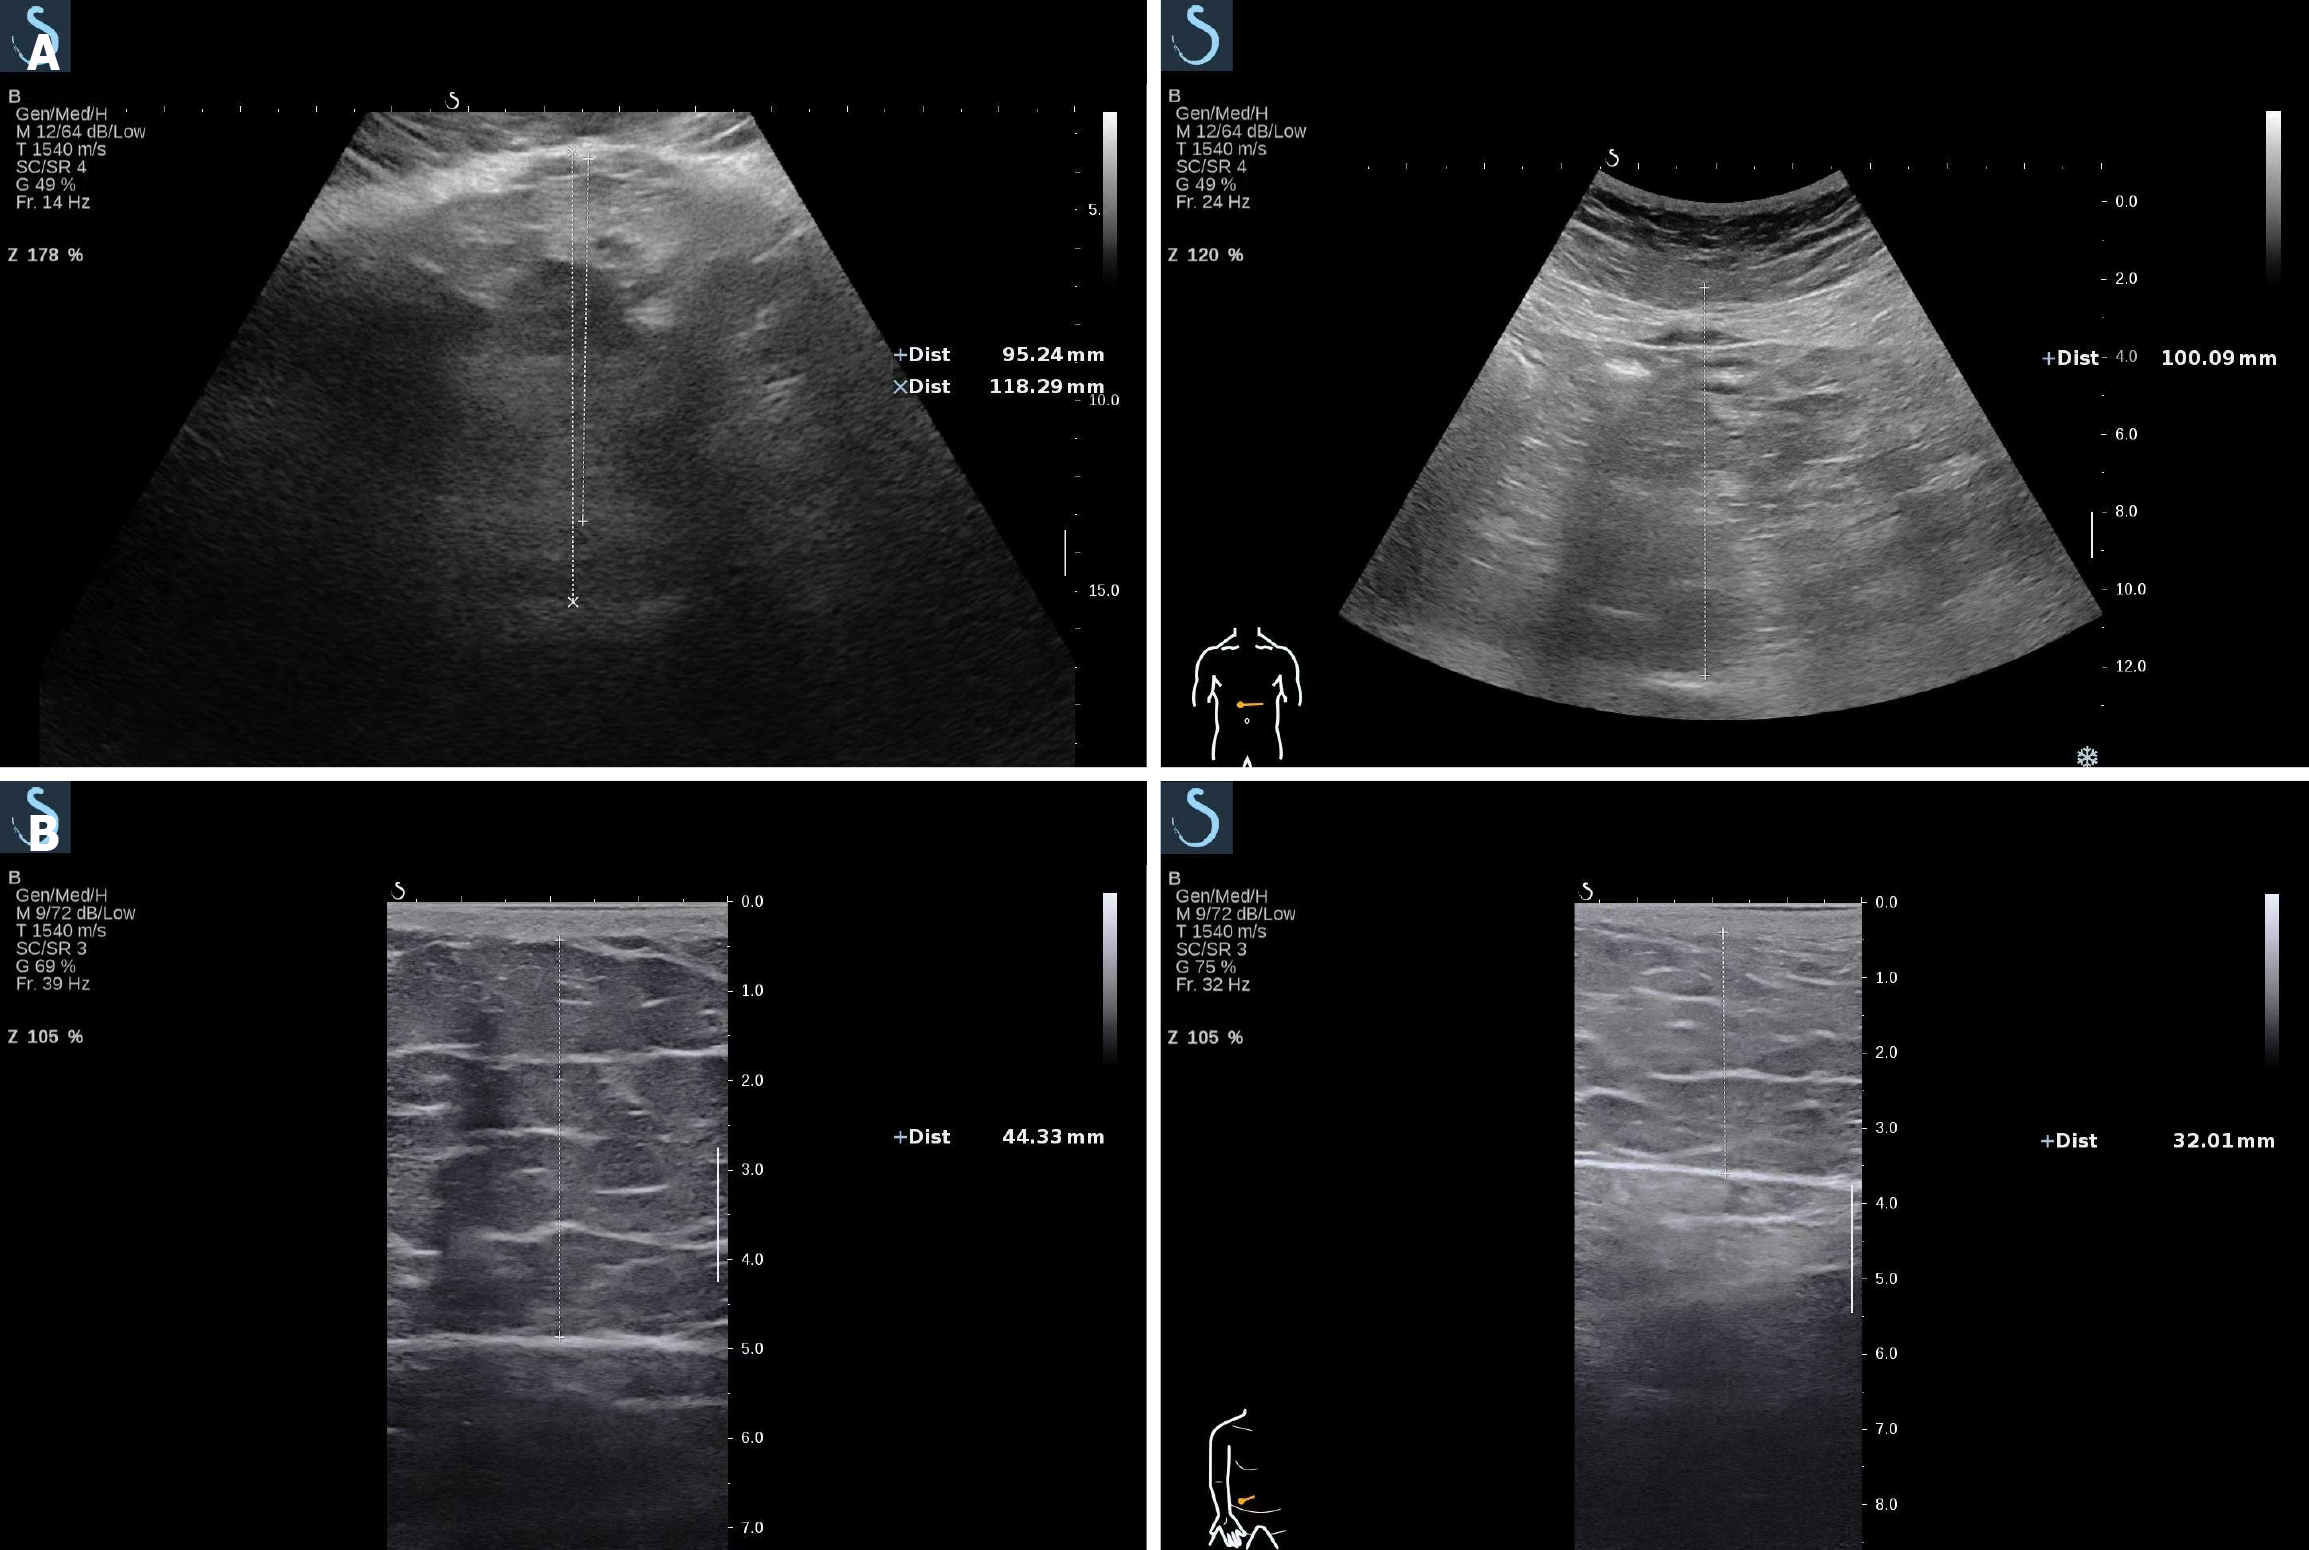
Figure 1 Ultrasound images.
A: Comparative ultrasound images of visceral fat thickness before and after treatment. Ultrasound measurements show a reduction in visceral fat thickness from 118.29 mm pre-treatment (upper image) to 100.09 mm post-treatment (lower image); B: Comparative ultrasound images of right paraumbilical subcutaneous fat thickness before and after treatment. Ultrasound measurements show a reduction in subcutaneous fat thickness from 44.33 mm pre-treatment (upper image) to 32.01 mm post-treatment (lower image).
- Citation: Guan JY, Zhao MY, Xie CY, Li ZM, Wang SY, Zhao EH, Lu XY, Li YC, Yuan MQ, Xu TC. Acupuncture-induced fat thickness reduction in different body regions: A case report and review of literature. World J Clin Cases 2026; 14(13): 119563
- URL: https://www.wjgnet.com/2307-8960/full/v14/i13/119563.htm
- DOI: https://dx.doi.org/10.12998/wjcc.v14.i13.119563