
















©The Author(s) 2025.
World J Clin Cases. Dec 26, 2025; 13(36): 113778
Published online Dec 26, 2025. doi: 10.12998/wjcc.v13.i36.113778
Published online Dec 26, 2025. doi: 10.12998/wjcc.v13.i36.113778
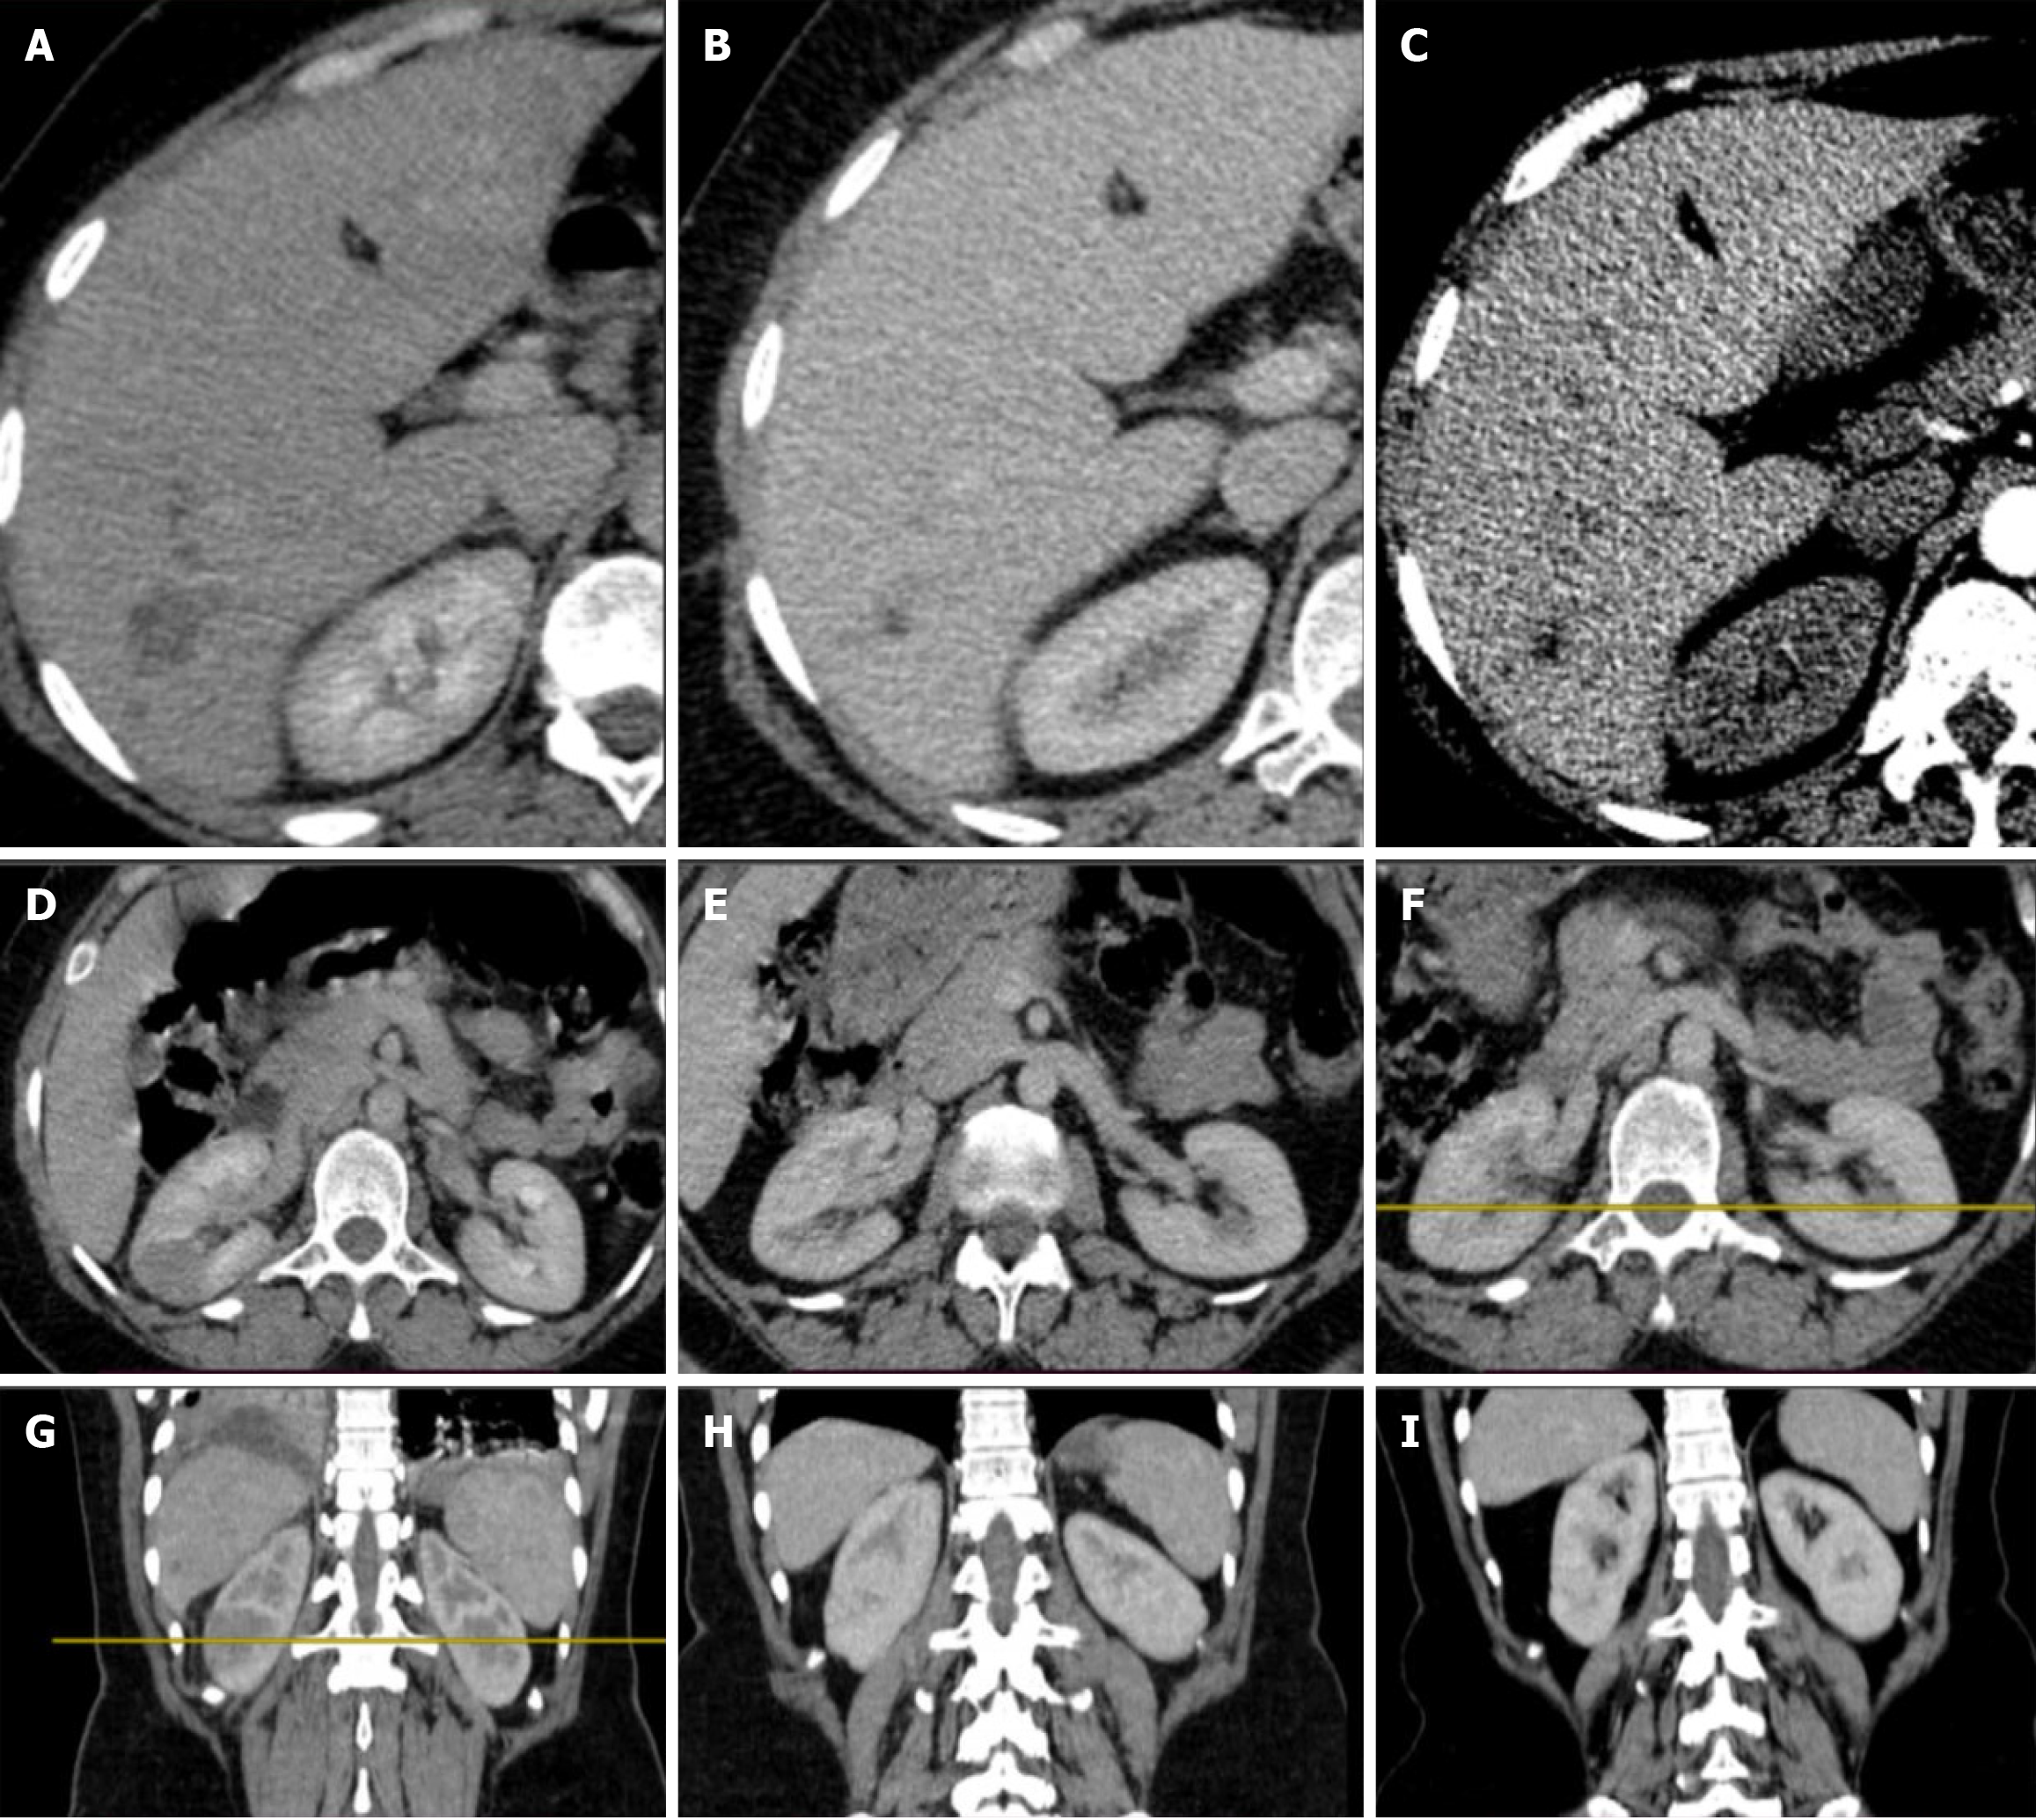
Figure 7 Serial computed tomography imaging depicting radiographic changes with treatment.
A-C: Abdominal computed tomography (CT) images of the liver showing changes with treatment; D-F: Abdominal CT images of the kidneys showing improvement with treatment; G-I: Abdominal CT scans demonstrating the progression of hepatic and renal lesions throughout the clinical course, from initial presentation to post-treatment follow-up.
- Citation: Mulate ST, Gesese BD, Nur AM, Mengistu HB, Annose RT, Berga AE, Ulfata AL. Hepatic fascioliasis: Emphasizing diagnostic difficulty and the need for high index of suspicion: Four case reports. World J Clin Cases 2025; 13(36): 113778
- URL: https://www.wjgnet.com/2307-8960/full/v13/i36/113778.htm
- DOI: https://dx.doi.org/10.12998/wjcc.v13.i36.113778