
















©The Author(s) 2025.
World J Clin Cases. Dec 26, 2025; 13(36): 113778
Published online Dec 26, 2025. doi: 10.12998/wjcc.v13.i36.113778
Published online Dec 26, 2025. doi: 10.12998/wjcc.v13.i36.113778
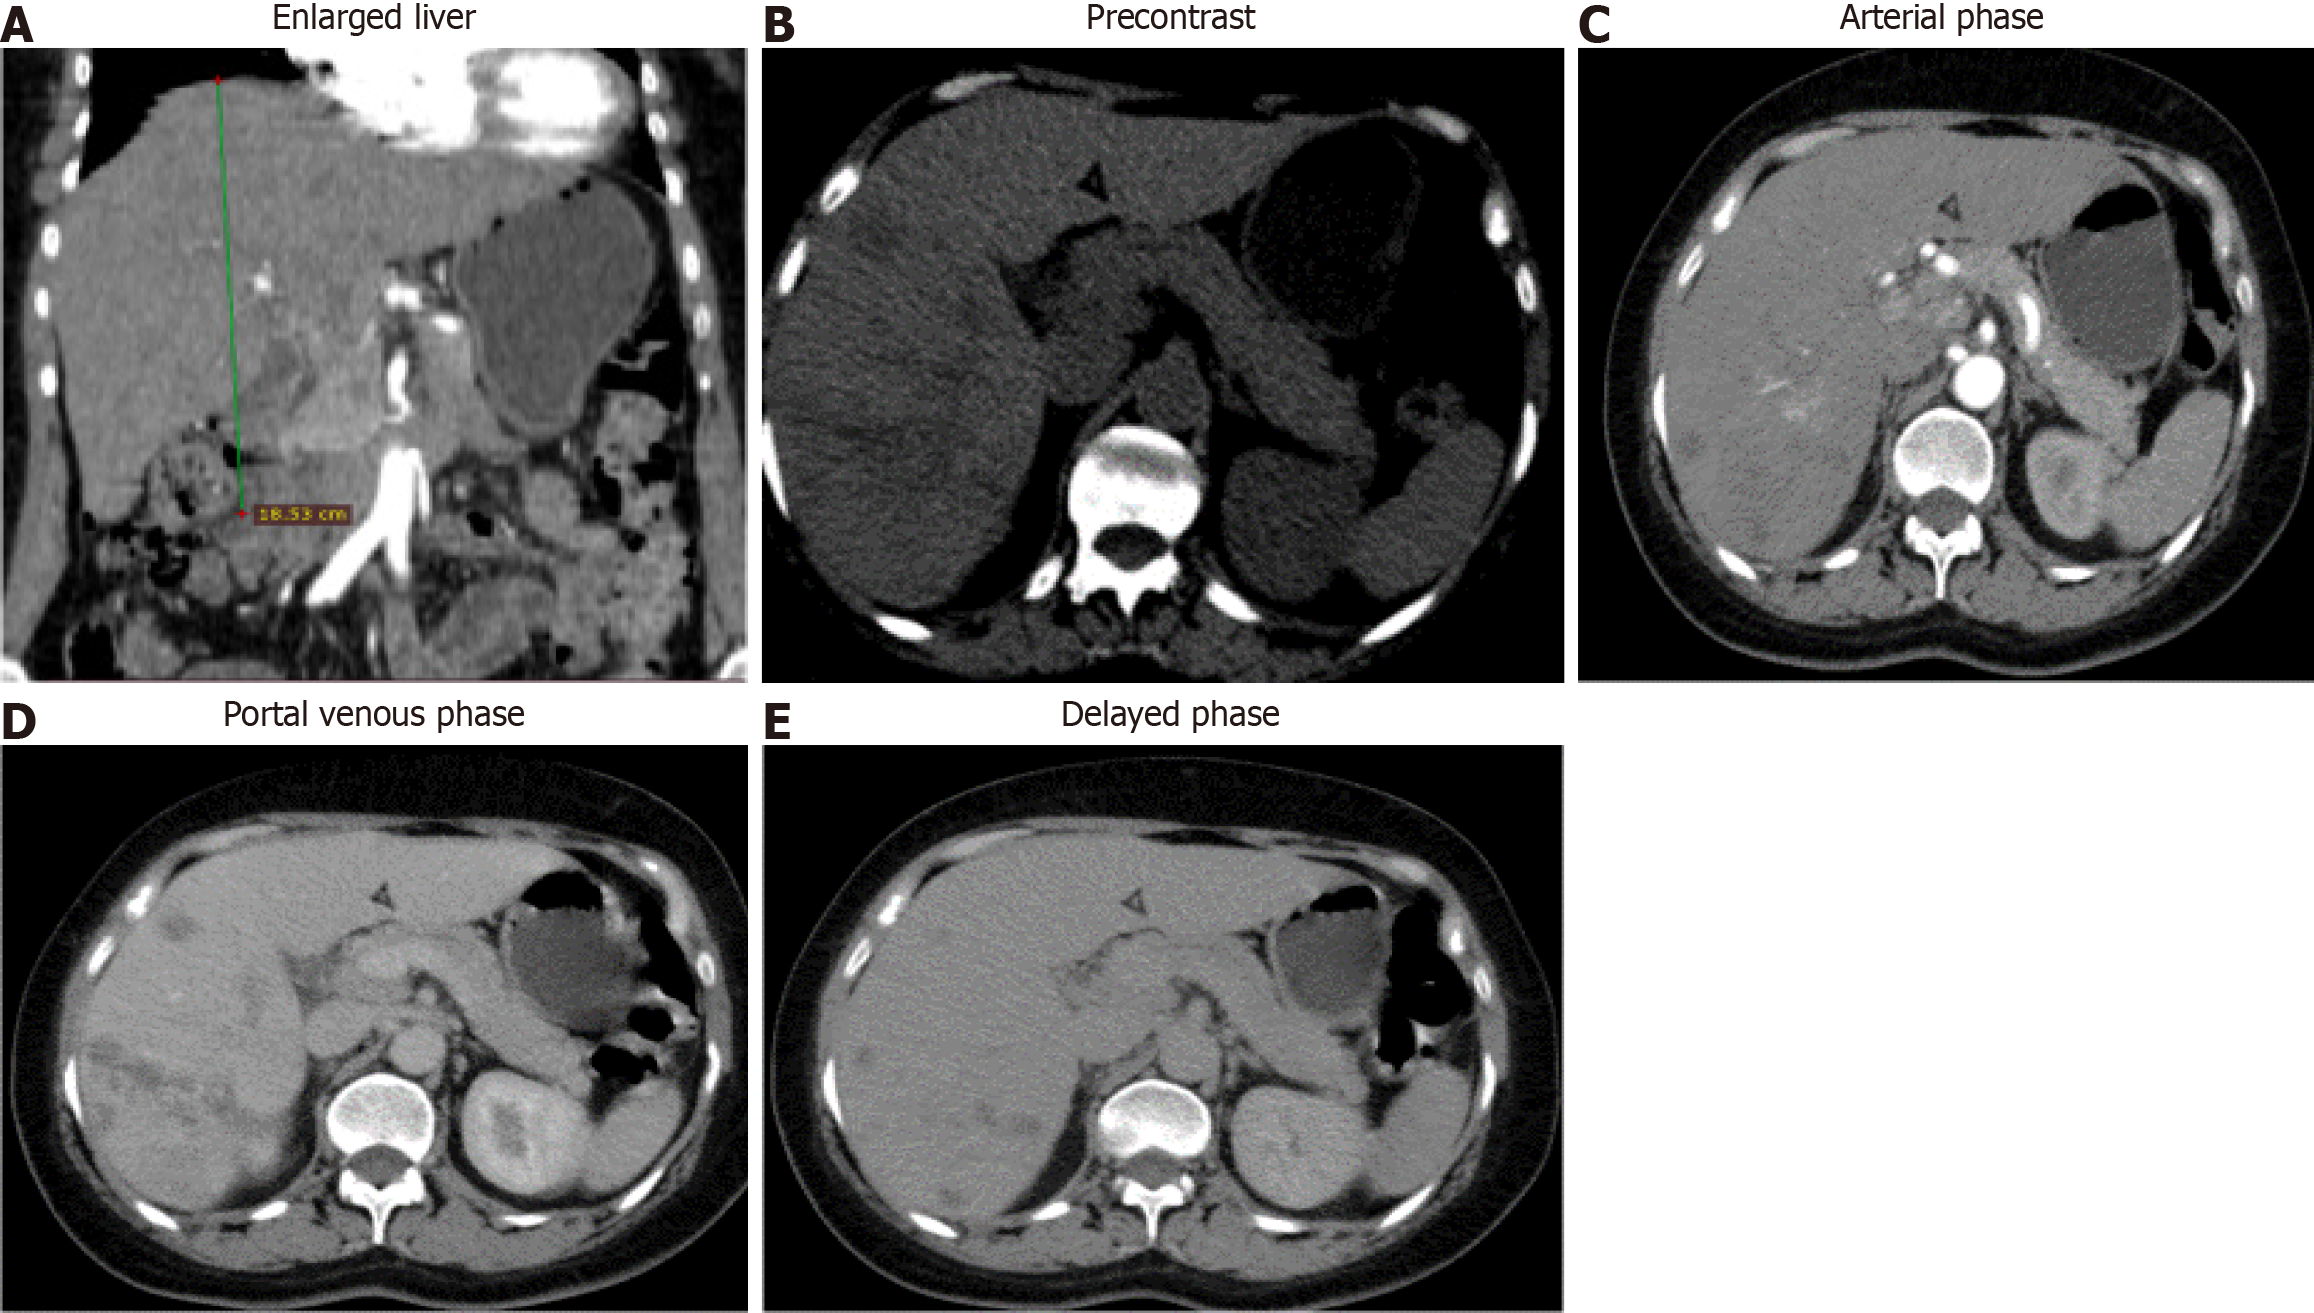
Figure 3 Abdominal computed tomography scan.
A: Abdominal computed tomography scan showed an enlarged liver; B: Shows multiple ill-defined hypodense lesions in the right lobe; C: Shows the largest lesion, a 5.3 cm × 3.3 cm measuring hypodense lesion having minimal arterial enhancement; D: Shows the delayed portal venous phase; E: Shows a slight filling in the delayed phase with the underlying hepatic parenchyma having internal attenuation more around the periportal area, which was consistent with fascioliasis.
- Citation: Mulate ST, Gesese BD, Nur AM, Mengistu HB, Annose RT, Berga AE, Ulfata AL. Hepatic fascioliasis: Emphasizing diagnostic difficulty and the need for high index of suspicion: Four case reports. World J Clin Cases 2025; 13(36): 113778
- URL: https://www.wjgnet.com/2307-8960/full/v13/i36/113778.htm
- DOI: https://dx.doi.org/10.12998/wjcc.v13.i36.113778