
















©The Author(s) 2025.
World J Clin Cases. Nov 16, 2025; 13(32): 110897
Published online Nov 16, 2025. doi: 10.12998/wjcc.v13.i32.110897
Published online Nov 16, 2025. doi: 10.12998/wjcc.v13.i32.110897
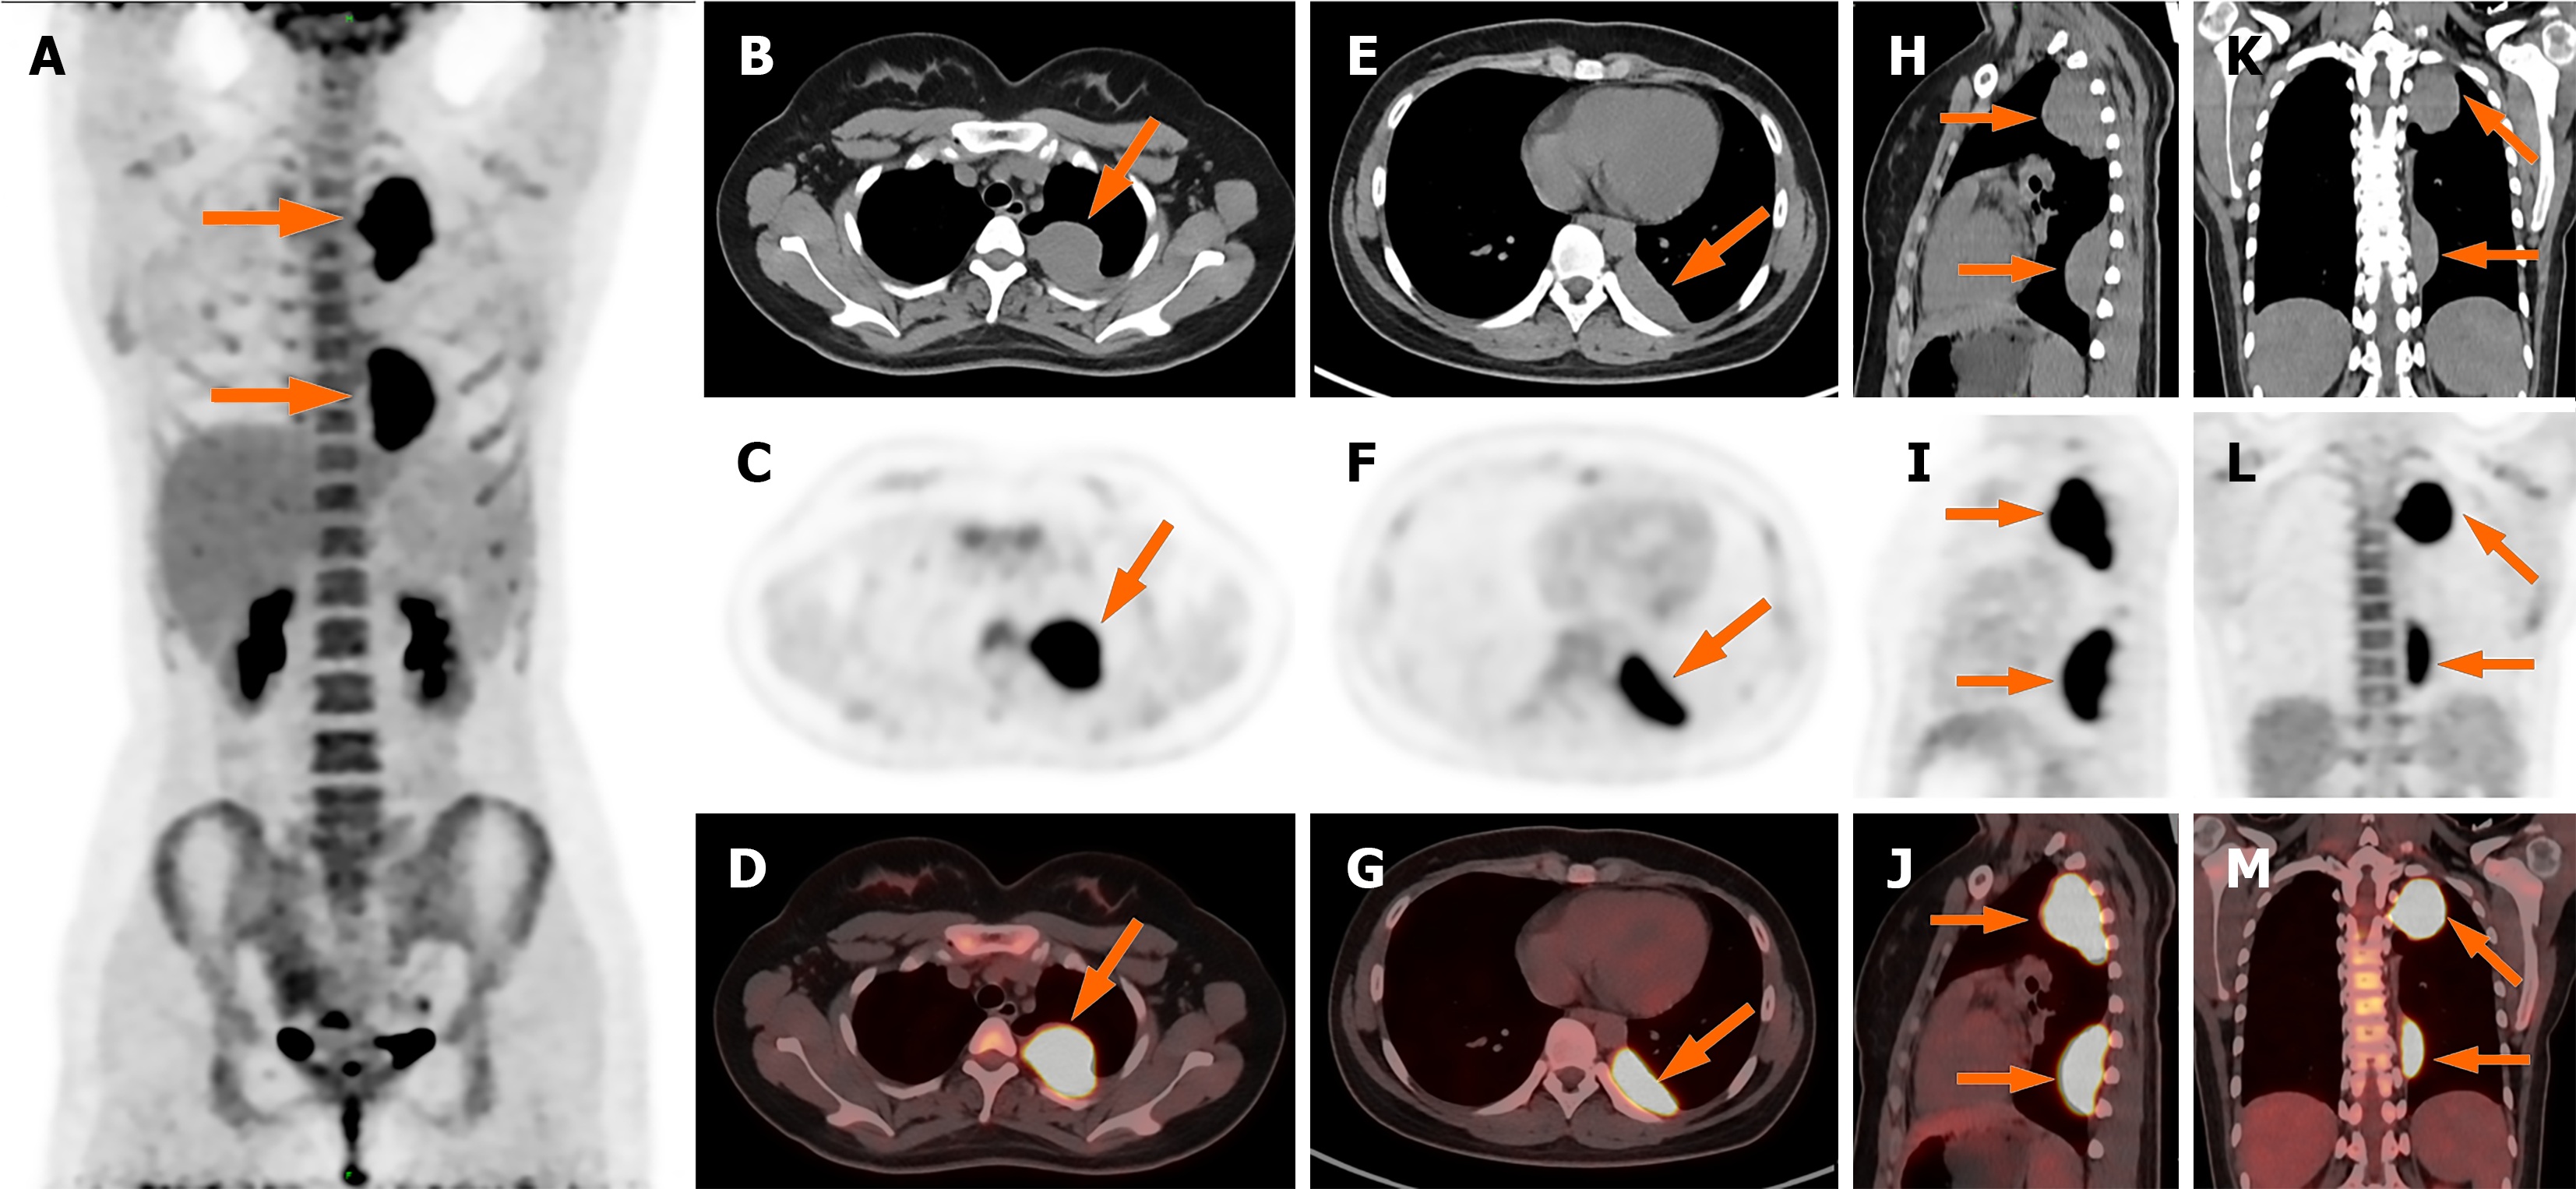
Figure 3 Whole body positron emission tomography/computed tomography images.
A: Maximum intensity projection image showed increased F-18 fluorodeoxyglucose (FDG) uptake in the lesion (arrow). No other FDG-avid lesions were detected elsewhere in the body. Lesion 1: B-M: Axial (B–D); Lesion 2: Axial (E–G), sagittal (H–J), and coronal (K–M) PET/CT demonstrated abnormally elevated FDG uptake in the lesions (SUVmax 14.0 and 13.7, respectively).
- Citation: Aisikaer A, Sun MM, Shen J. Positron emission tomography/computed tomography in risk-factor-negative young female with malignant pleural mesothelioma: A case report and review of literature. World J Clin Cases 2025; 13(32): 110897
- URL: https://www.wjgnet.com/2307-8960/full/v13/i32/110897.htm
- DOI: https://dx.doi.org/10.12998/wjcc.v13.i32.110897