
















©The Author(s) 2025.
World J Clin Cases. Oct 26, 2025; 13(30): 109212
Published online Oct 26, 2025. doi: 10.12998/wjcc.v13.i30.109212
Published online Oct 26, 2025. doi: 10.12998/wjcc.v13.i30.109212
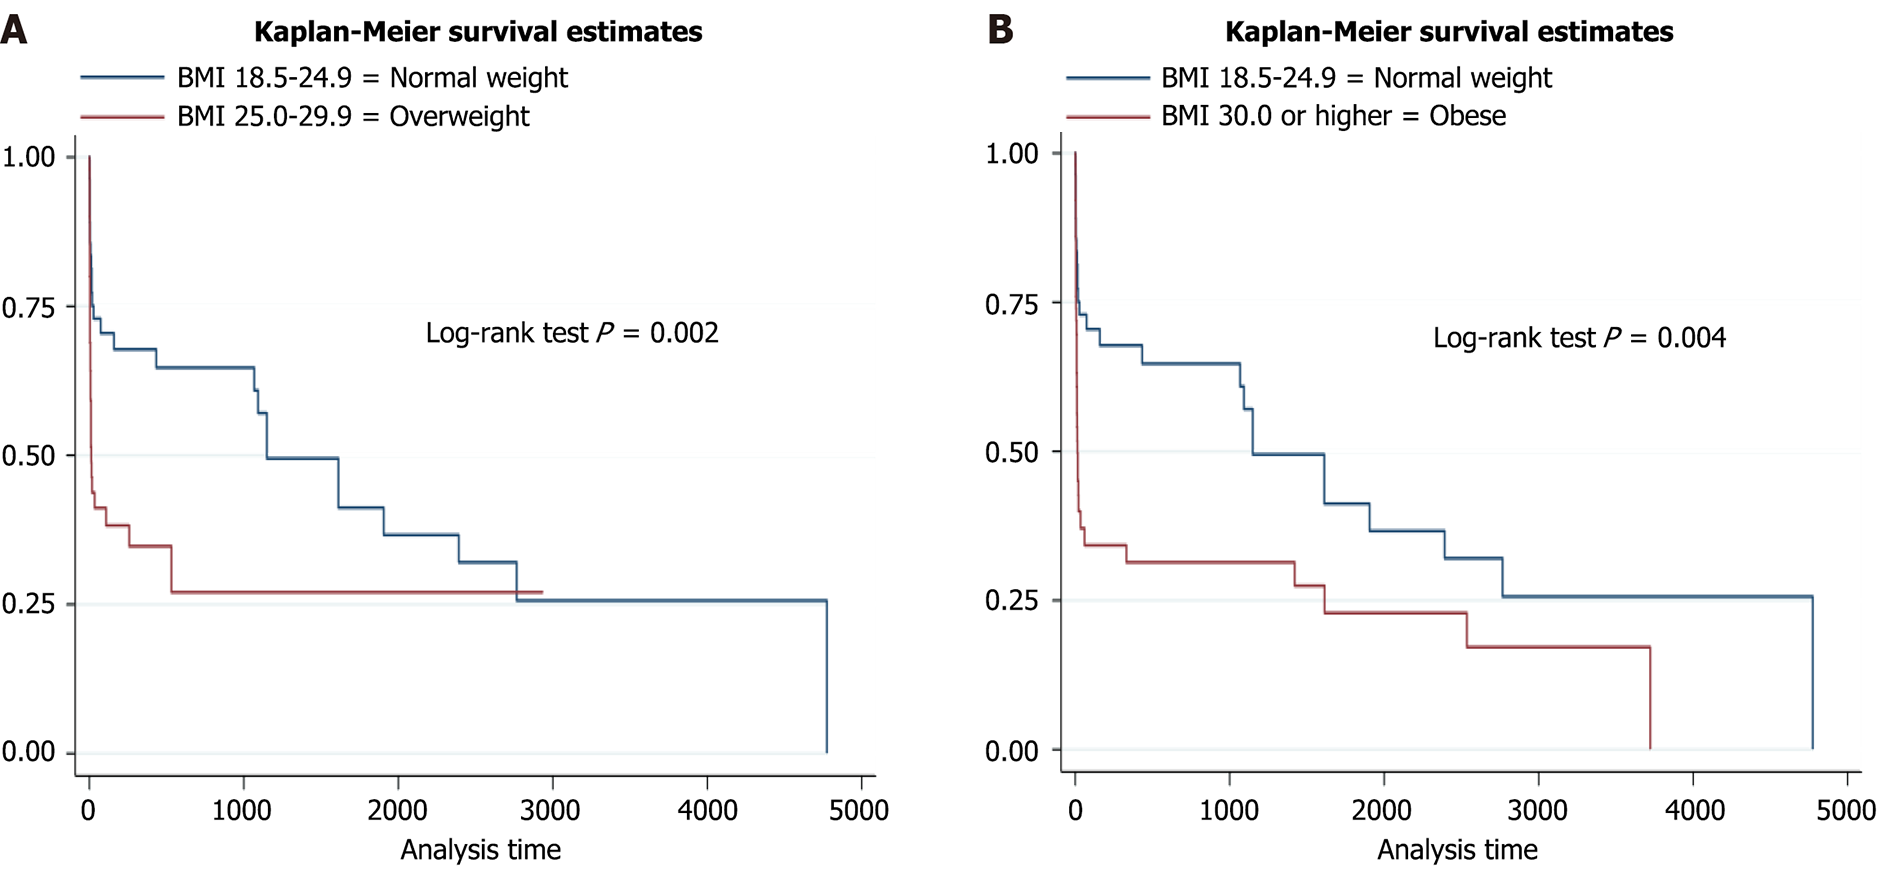
Figure 4 Kaplan–Meier analysis curve based on the patient's body mass index.
A: Kaplan-Meier survival analysis comparing normal weight [body mass index (BMI) 18.5-24.9 kg/m²] vs obese (BMI ≥ 30 kg/m²) patients with acute liver failure (ALF); B: Kaplan-Meier survival analysis comparing normal weight (BMI: 18.5-24.9 kg/m²) vs overweight (BMI: 25.0-29.9 kg/m²) patients with ALF. BMI: Body mass index.
- Citation: Krishnan A, Khan S, Gips J, Alqahtani SA, Vaidya D, Liu YS, Kim A, Su A, Gurakar A, Hamilton JP, Woreta TA. Body mass index and its association with clinical outcomes in acute liver failure. World J Clin Cases 2025; 13(30): 109212
- URL: https://www.wjgnet.com/2307-8960/full/v13/i30/109212.htm
- DOI: https://dx.doi.org/10.12998/wjcc.v13.i30.109212