
















©The Author(s) 2025.
World J Clin Cases. Oct 6, 2025; 13(28): 109077
Published online Oct 6, 2025. doi: 10.12998/wjcc.v13.i28.109077
Published online Oct 6, 2025. doi: 10.12998/wjcc.v13.i28.109077
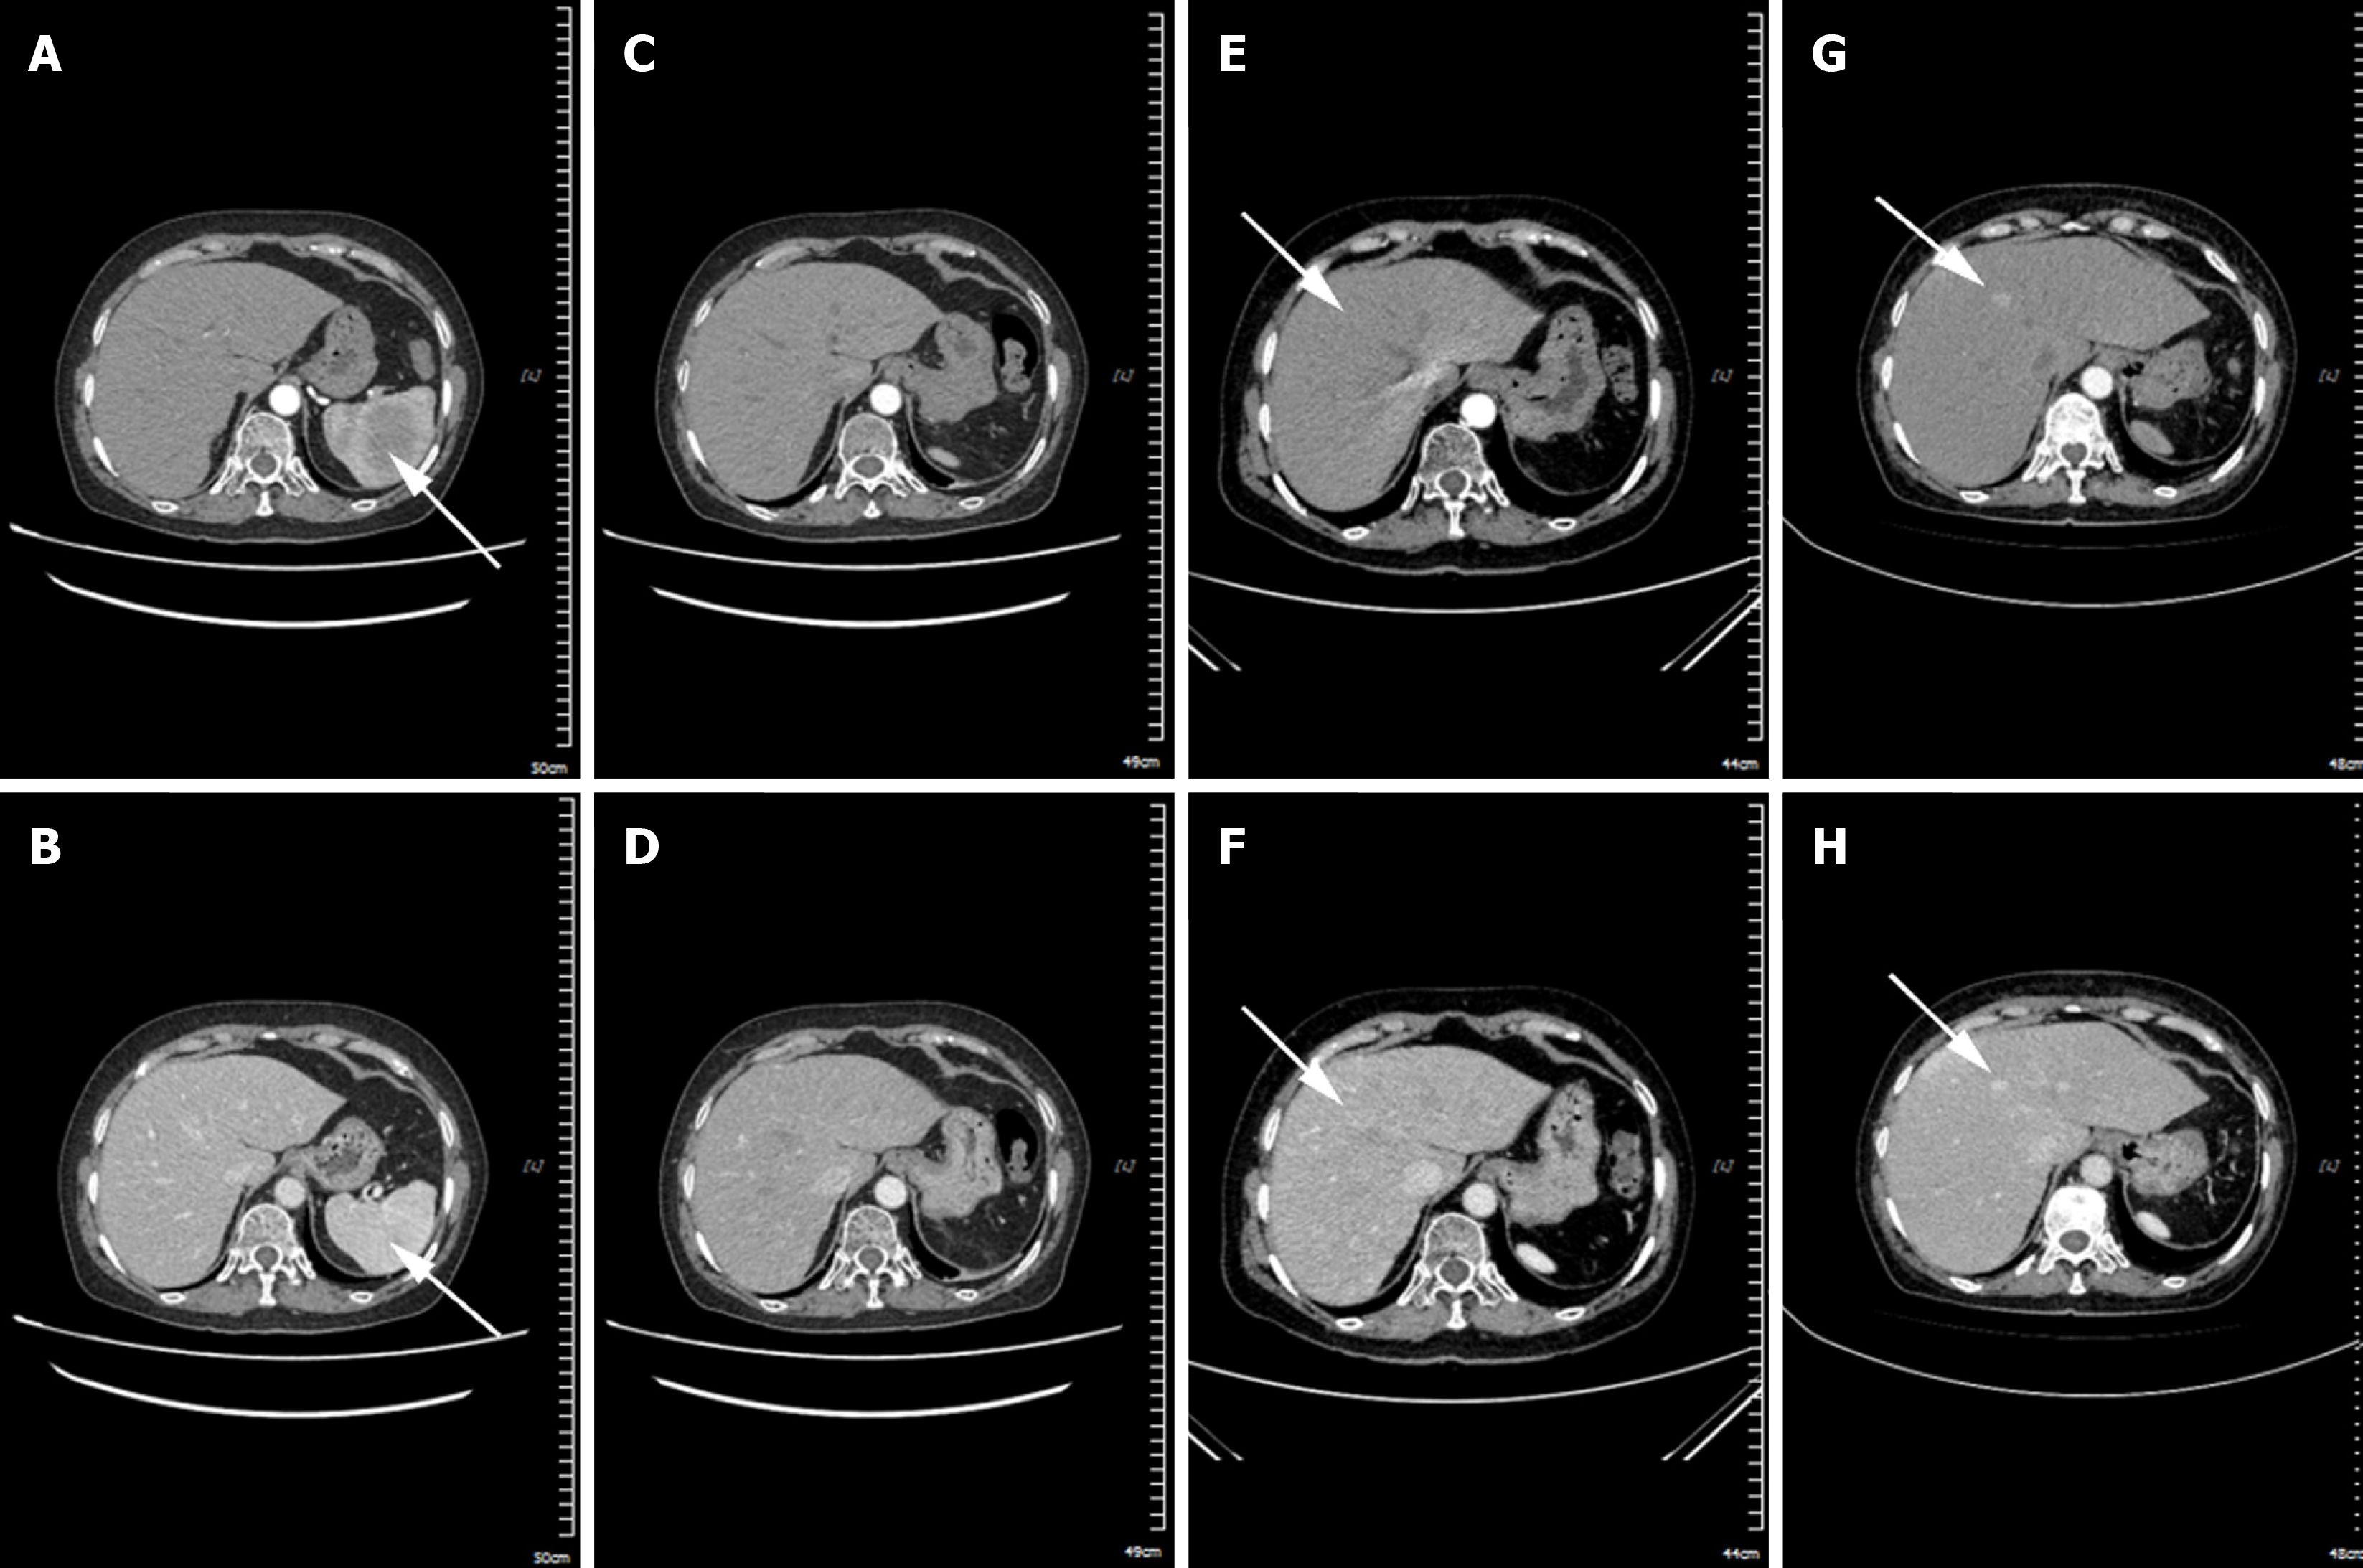
Figure 4 Abdominal computed tomography angiograph scan of the case (transverse section).
A and B: In April 2020, the splenic histiocytic sarcoma measured approximately 6.0 cm × 5.7 cm (A: Arterial phase) and (B: Venous phase), with a computed tomography value of around 48 HU, and exhibited progressive enhancement; C and D: In June 2020, following splenectomy, no spleen was visualized in the splenic area (C: Arterial phase) and (D: Venous phase), and the fat space surrounding the operative site was slightly disturbed (Phase 1); E and F: In June 2022, multiple nodular enhancement shadows were present in the liver (E: Arterial phase) and (F: Venous phase); the larger one was located in the left medial lobe of the liver, measuring approximately 2.4 cm× 2.9 (Phase 2); G and H: In September 2022, multiple nodular enhancement shadows were observed in the liver (G: Arterial phase) and (H: Venous phase). The larger one, located in the left medial lobe of the liver, had an extent of approximately 4.3 cm × 2.7 cm (Phase 3). The white arrow indicates the tumor.
- Citation: Yao MT, Wang T, Luo H, Yao MY, Chen K, Zhu YQ. Splenic histiocytic sarcoma: Disease progression from the perspective of pathophysiology. World J Clin Cases 2025; 13(28): 109077
- URL: https://www.wjgnet.com/2307-8960/full/v13/i28/109077.htm
- DOI: https://dx.doi.org/10.12998/wjcc.v13.i28.109077