Copyright
©The Author(s) 2025.
World J Clin Cases. Oct 6, 2025; 13(28): 109077
Published online Oct 6, 2025. doi: 10.12998/wjcc.v13.i28.109077
Published online Oct 6, 2025. doi: 10.12998/wjcc.v13.i28.109077
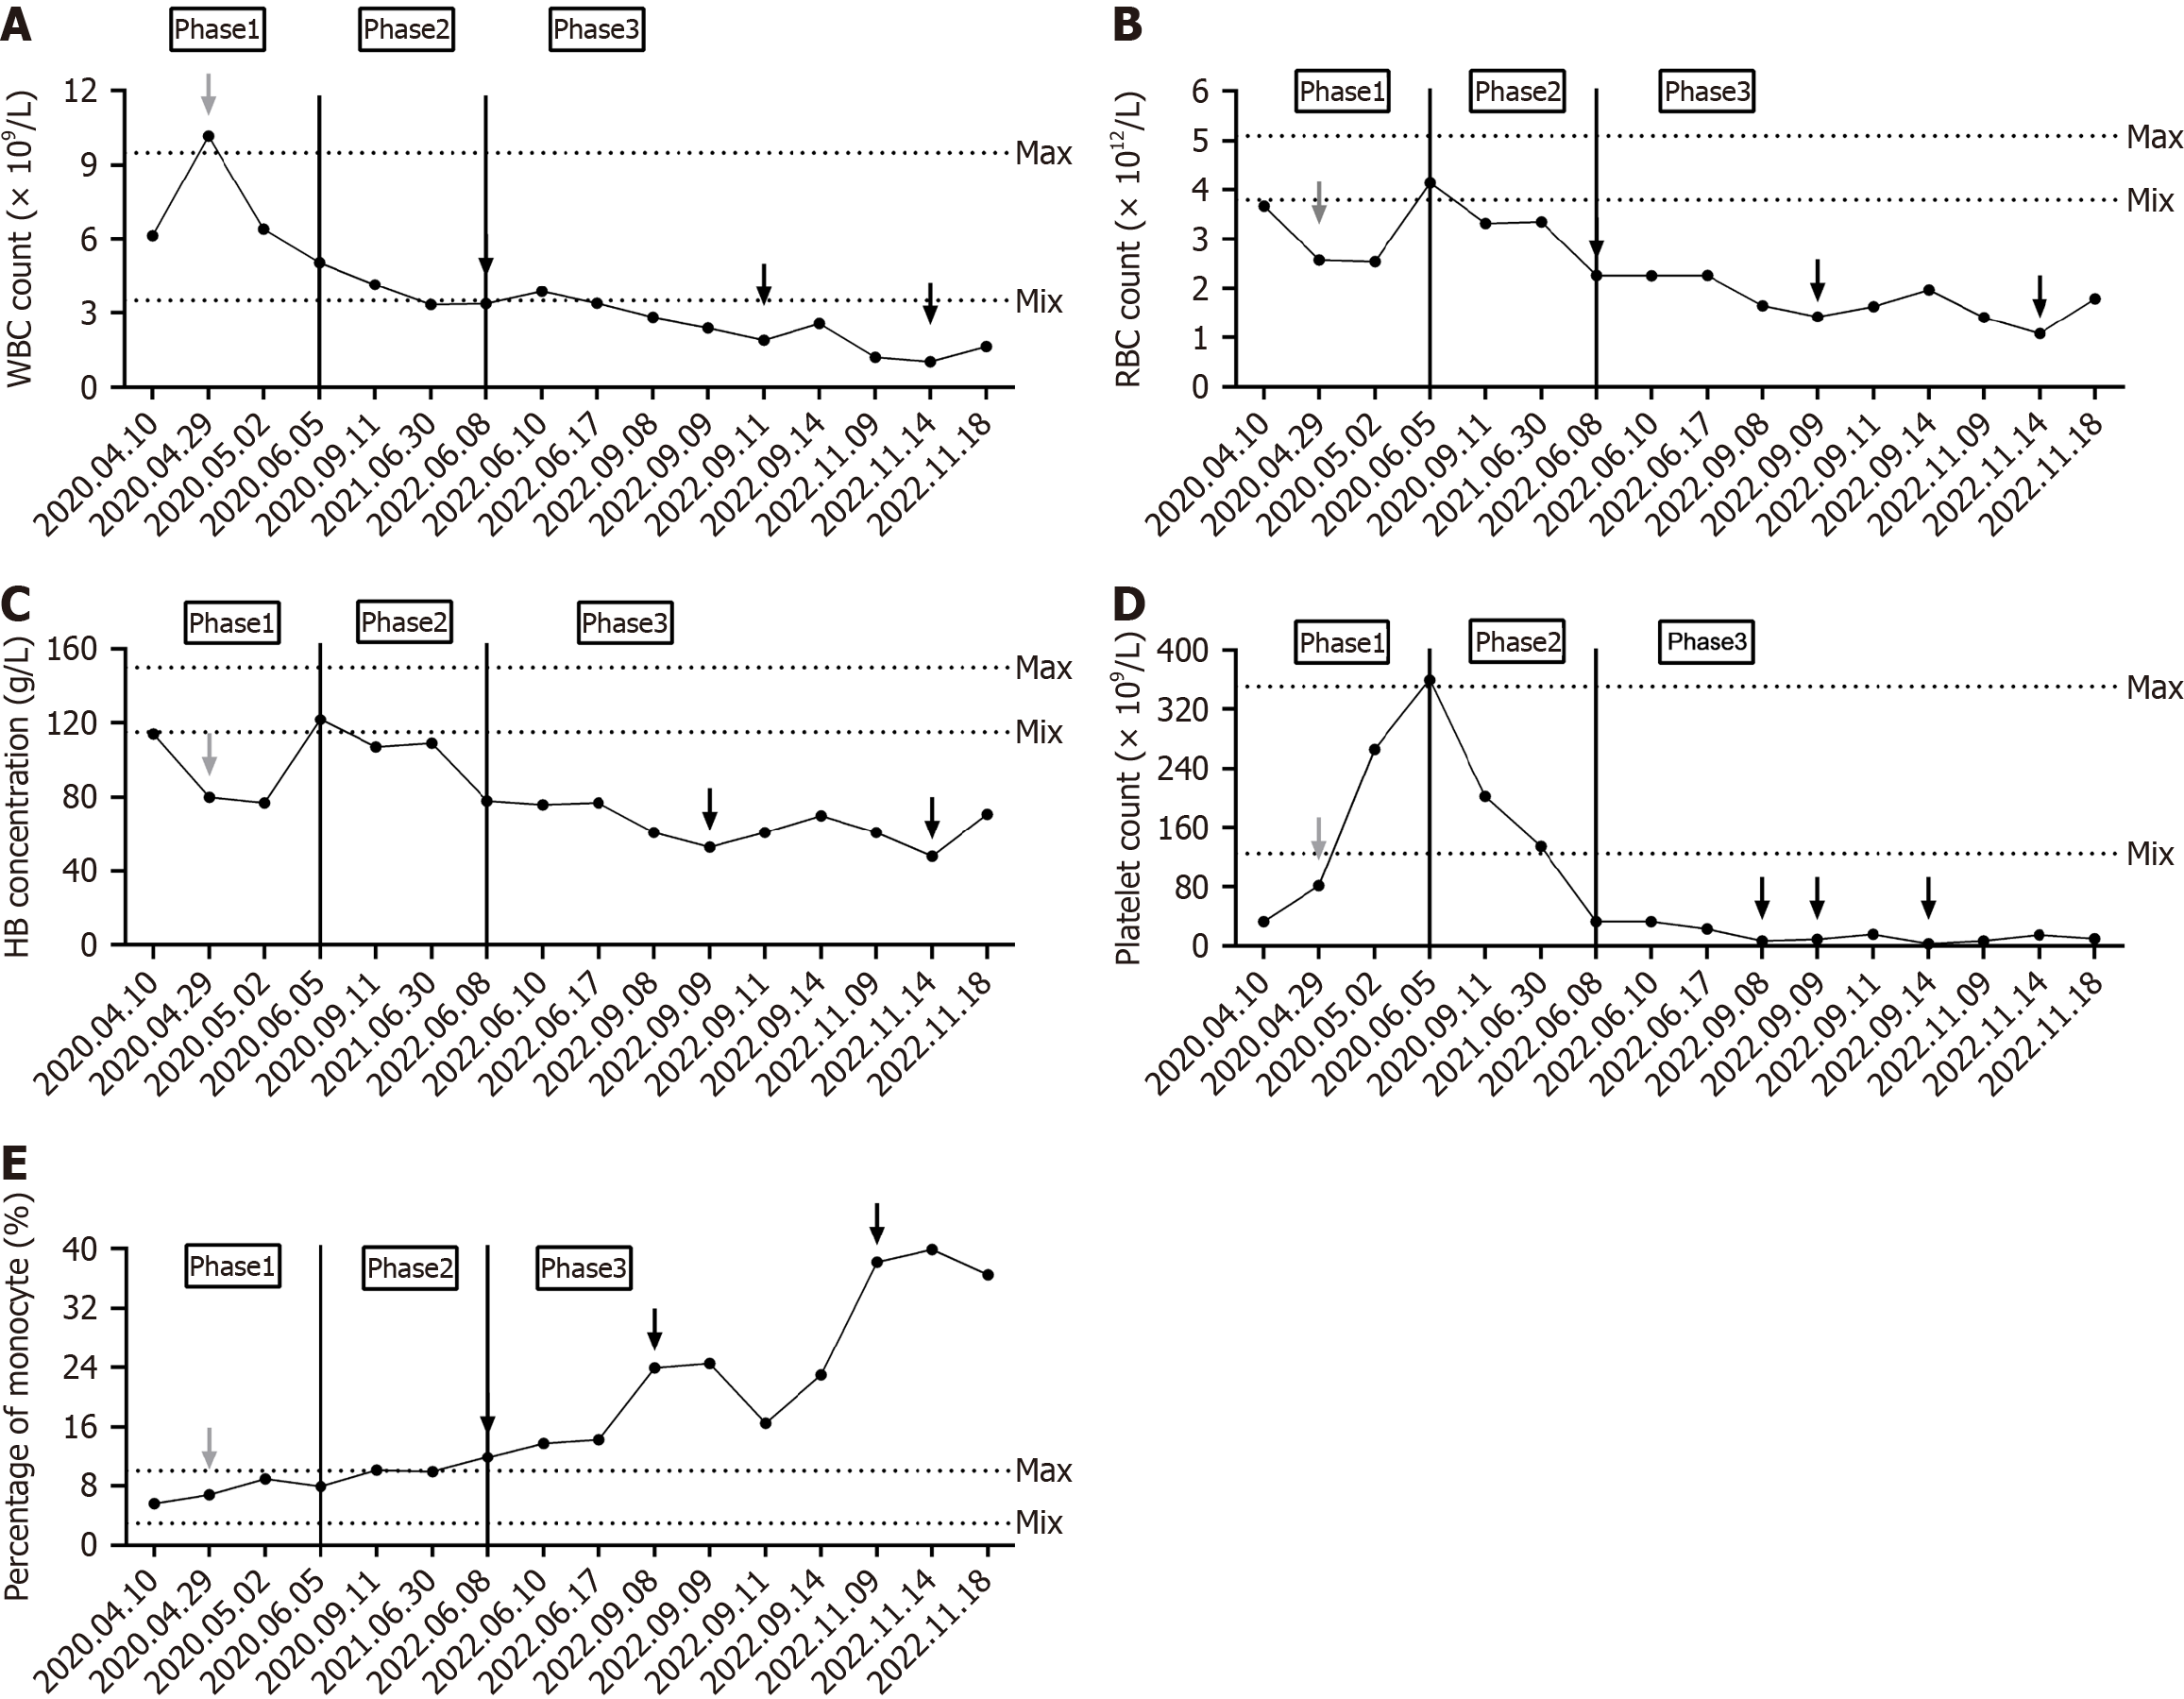
Figure 2 Changes in blood routine from the first admission to the last admission of the case.
A: White blood cell count. The black arrows in the figure denote the transfusion of frozen plasma; B: Red blood cell count. The black arrows in the figure represent the infusion of suspended red blood cells; C: Hemoglobin concentration. The black arrows in the figure represent the infusion of suspended red blood cells; D: Platelet count. The black arrows in the figure denote the transfusion of platelets and cryoprecipitation; E: Monocyte percentage. The black arrows in the figure denote the transfusion of frozen plasma. The range between dotted lines represents the normal reference range for a given indicator. The gray arrows in the figure represent surgical treatment. Phases 1, 2, and 3, delineated by the solid black line, correspond to early splenic histiocytic sarcoma (SHS), mid-SHS, and late SHS, respectively. WBC: White blood cell; RBC: Red blood cell; HB: Hemoglobin.
- Citation: Yao MT, Wang T, Luo H, Yao MY, Chen K, Zhu YQ. Splenic histiocytic sarcoma: Disease progression from the perspective of pathophysiology. World J Clin Cases 2025; 13(28): 109077
- URL: https://www.wjgnet.com/2307-8960/full/v13/i28/109077.htm
- DOI: https://dx.doi.org/10.12998/wjcc.v13.i28.109077


