Copyright
©The Author(s) 2025.
World J Clin Cases. Sep 26, 2025; 13(27): 109243
Published online Sep 26, 2025. doi: 10.12998/wjcc.v13.i27.109243
Published online Sep 26, 2025. doi: 10.12998/wjcc.v13.i27.109243
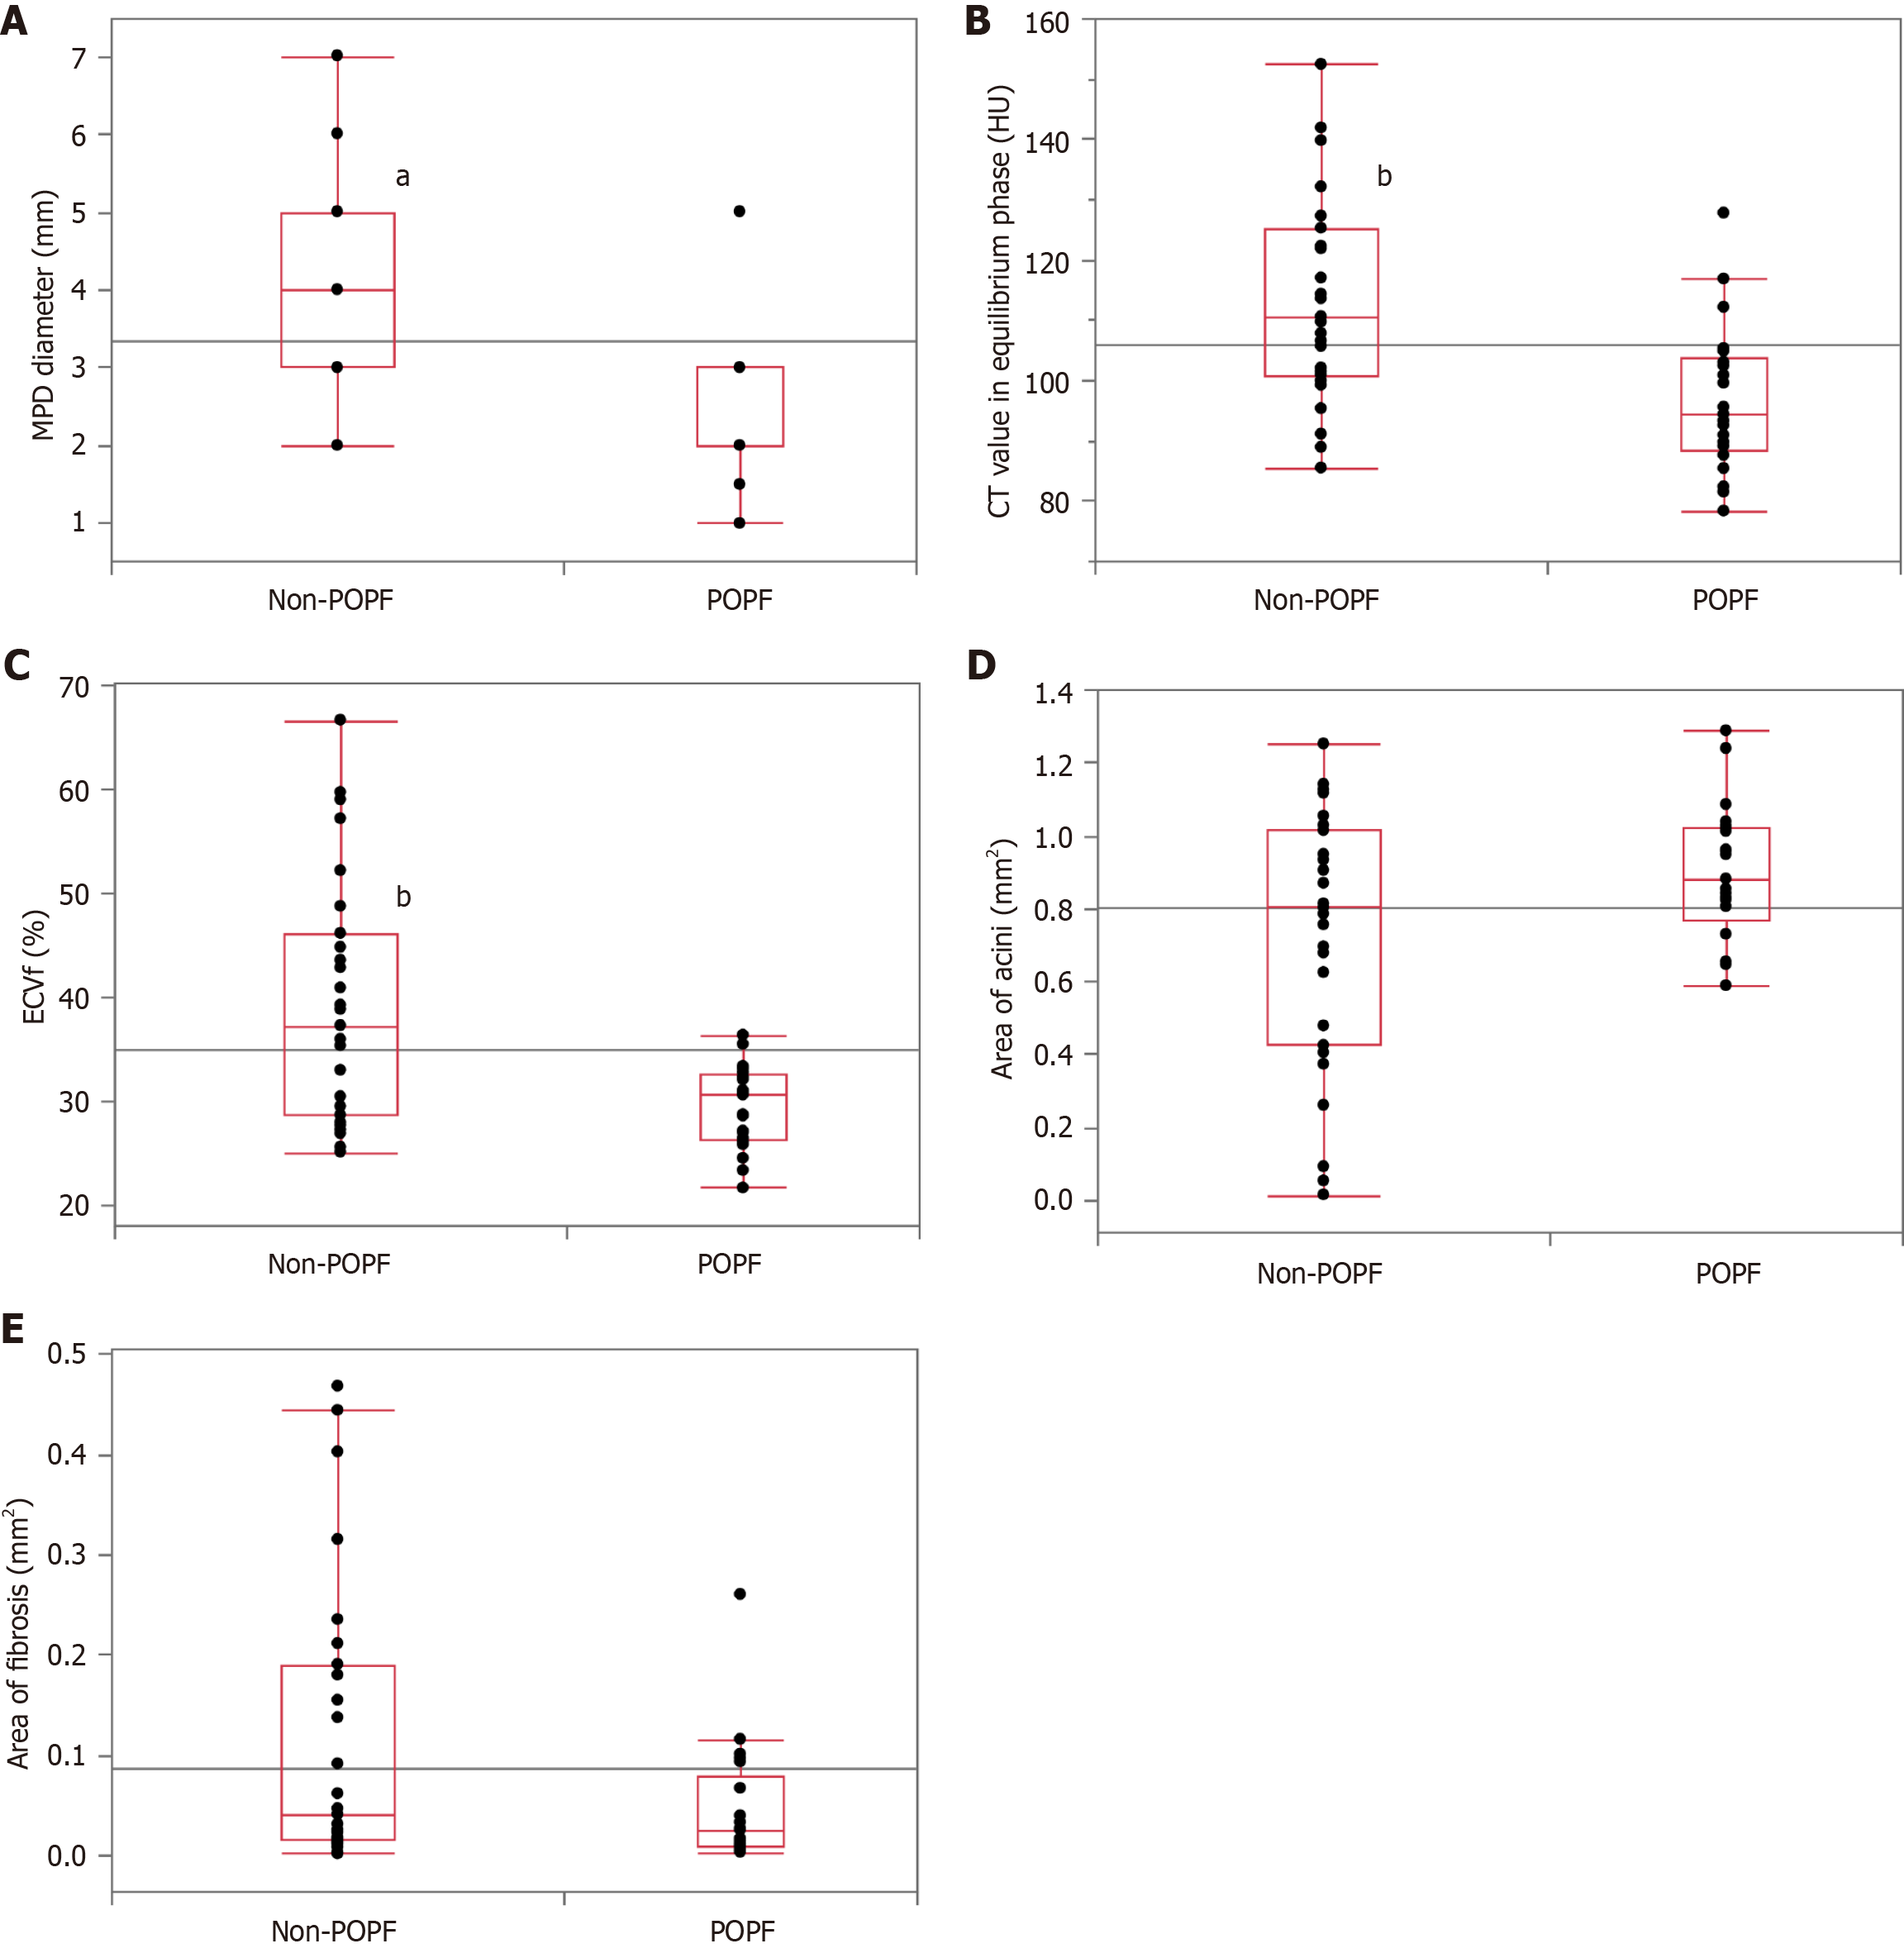
Figure 5 Comparison between non-postoperative pancreatic fistula group and postoperative pancreatic fistula group in the imaging and histopathological findings.
A: Main pancreatic duct diameter (4 mm vs 2 mm; P < 0.001); B: Computed tomography value in equilibrium phase (110.5 HU vs 94.3 HU; P = 0.001); C: Extracellular volume fraction (37.2% vs 30.5%; P = 0.003); D: Area of acini (0.802 mm2vs 0.880 mm2; P = 0.127); E: Area of fibrosis (0.041 mm² vs 0.026 mm²; P = 0.110). aP < 0.001; bP < 0.01. POPF: Postoperative pancreatic fistula; MPD: Main pancreatic duct; CT: Computed tomography; ECVf: Extracellular volume fraction.
- Citation: Nakamura A, Ogawa T, Tanaka K, Takahashi Y, Murai S, Tashiro Y, Wada A, Ueda Y, Sasaki Y, Minegishi Y, Matsuo K, Yamochi T. Estimation of pancreatic histology and likelihood of postoperative pancreatic fistula using extracellular volume fraction from contrast-enhanced computed tomography. World J Clin Cases 2025; 13(27): 109243
- URL: https://www.wjgnet.com/2307-8960/full/v13/i27/109243.htm
- DOI: https://dx.doi.org/10.12998/wjcc.v13.i27.109243


