Copyright
©The Author(s) 2025.
World J Clin Cases. Sep 26, 2025; 13(27): 109243
Published online Sep 26, 2025. doi: 10.12998/wjcc.v13.i27.109243
Published online Sep 26, 2025. doi: 10.12998/wjcc.v13.i27.109243
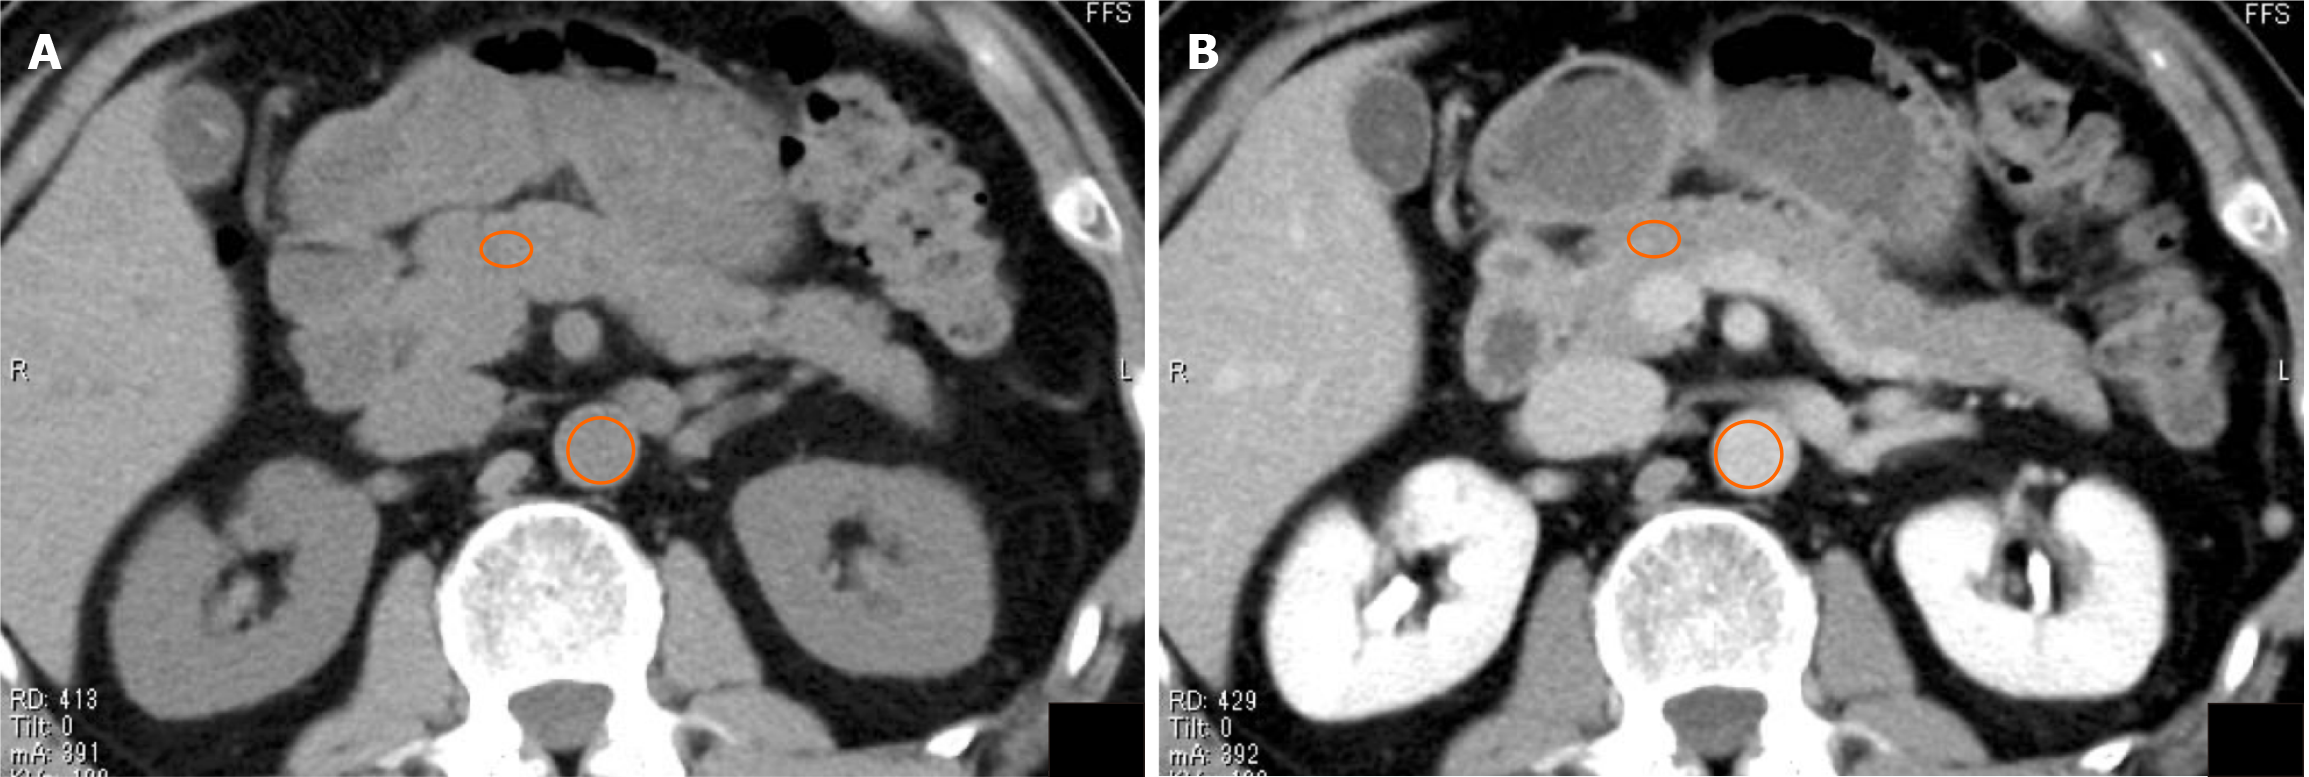
Figure 2 Computed tomography from a 51-year-old male with pancreatic neuroendocrine neoplasm.
A: Represents the precontrast phase; mean computed tomography (CT) value of the pancreas (ellipse), 45.2 HU and mean CT value of the aorta (circle), 43.6 HU; B: Represents the equilibrium phase, with the mean CT value of the pancreas (ellipse) being 78.3 HU and the mean CT value of the aorta (circle) being 125 HU. Extracellular volume fraction in this case was calculated to be 23.3%.
- Citation: Nakamura A, Ogawa T, Tanaka K, Takahashi Y, Murai S, Tashiro Y, Wada A, Ueda Y, Sasaki Y, Minegishi Y, Matsuo K, Yamochi T. Estimation of pancreatic histology and likelihood of postoperative pancreatic fistula using extracellular volume fraction from contrast-enhanced computed tomography. World J Clin Cases 2025; 13(27): 109243
- URL: https://www.wjgnet.com/2307-8960/full/v13/i27/109243.htm
- DOI: https://dx.doi.org/10.12998/wjcc.v13.i27.109243


