
















©The Author(s) 2025.
World J Clin Cases. Jun 16, 2025; 13(17): 103350
Published online Jun 16, 2025. doi: 10.12998/wjcc.v13.i17.103350
Published online Jun 16, 2025. doi: 10.12998/wjcc.v13.i17.103350
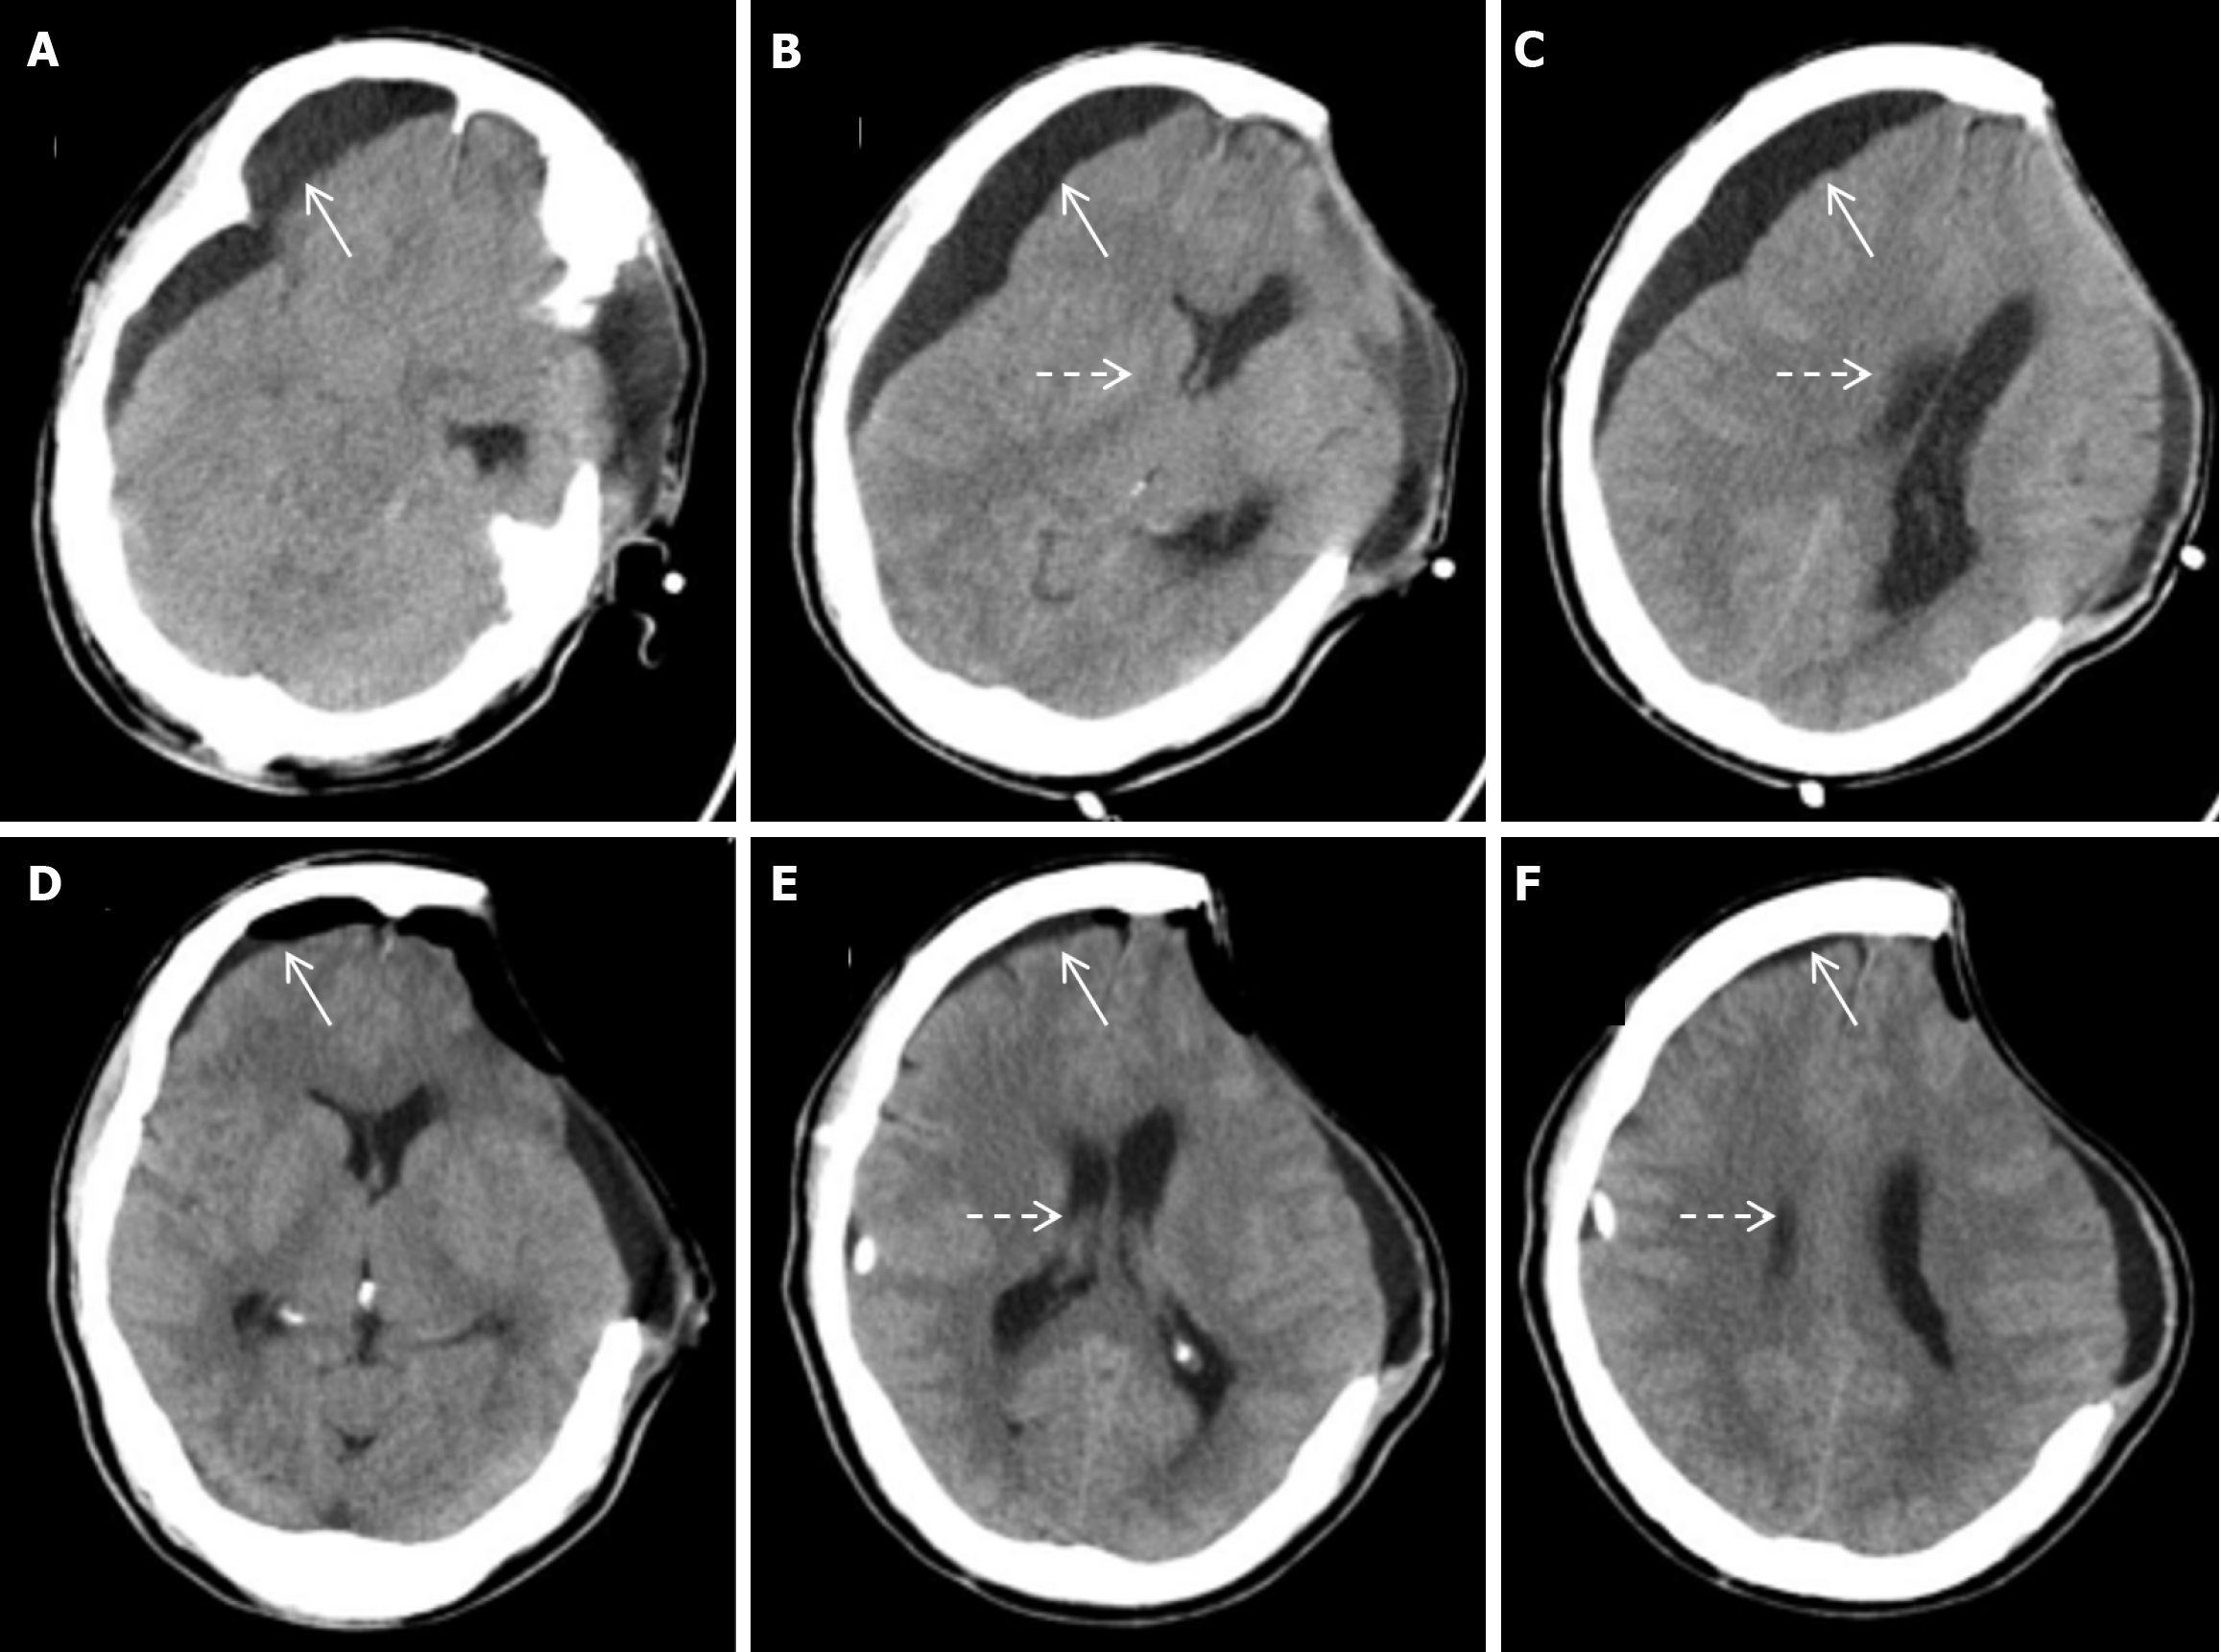
Figure 4 Computed tomography scan twentieth day after decompressive craniectomy.
A-C: On the twentieth day after decompressive craniectomy, a computed tomography scan was performed again, showing a recurrence of subdural fluid accumulation on the right side (solid white arrow), with the midline shifting to the left again and significant compression on the right ventricle (dashed white arrow); D-F: After the second subdural puncture drainage surgery, a 7-day follow-up examination showed that the right-sided subdural effusion had basically disappeared (white solid arrows), the midline was basically centered, and the compression of the right lateral ventricle had improved (white dashed arrows).
- Citation: Lin MJ. Intractable subdural effusion after decompressive craniectomy for traumatic brain injury: A case report. World J Clin Cases 2025; 13(17): 103350
- URL: https://www.wjgnet.com/2307-8960/full/v13/i17/103350.htm
- DOI: https://dx.doi.org/10.12998/wjcc.v13.i17.103350