
















©The Author(s) 2024.
World J Clin Cases. Mar 26, 2024; 12(9): 1622-1633
Published online Mar 26, 2024. doi: 10.12998/wjcc.v12.i9.1622
Published online Mar 26, 2024. doi: 10.12998/wjcc.v12.i9.1622
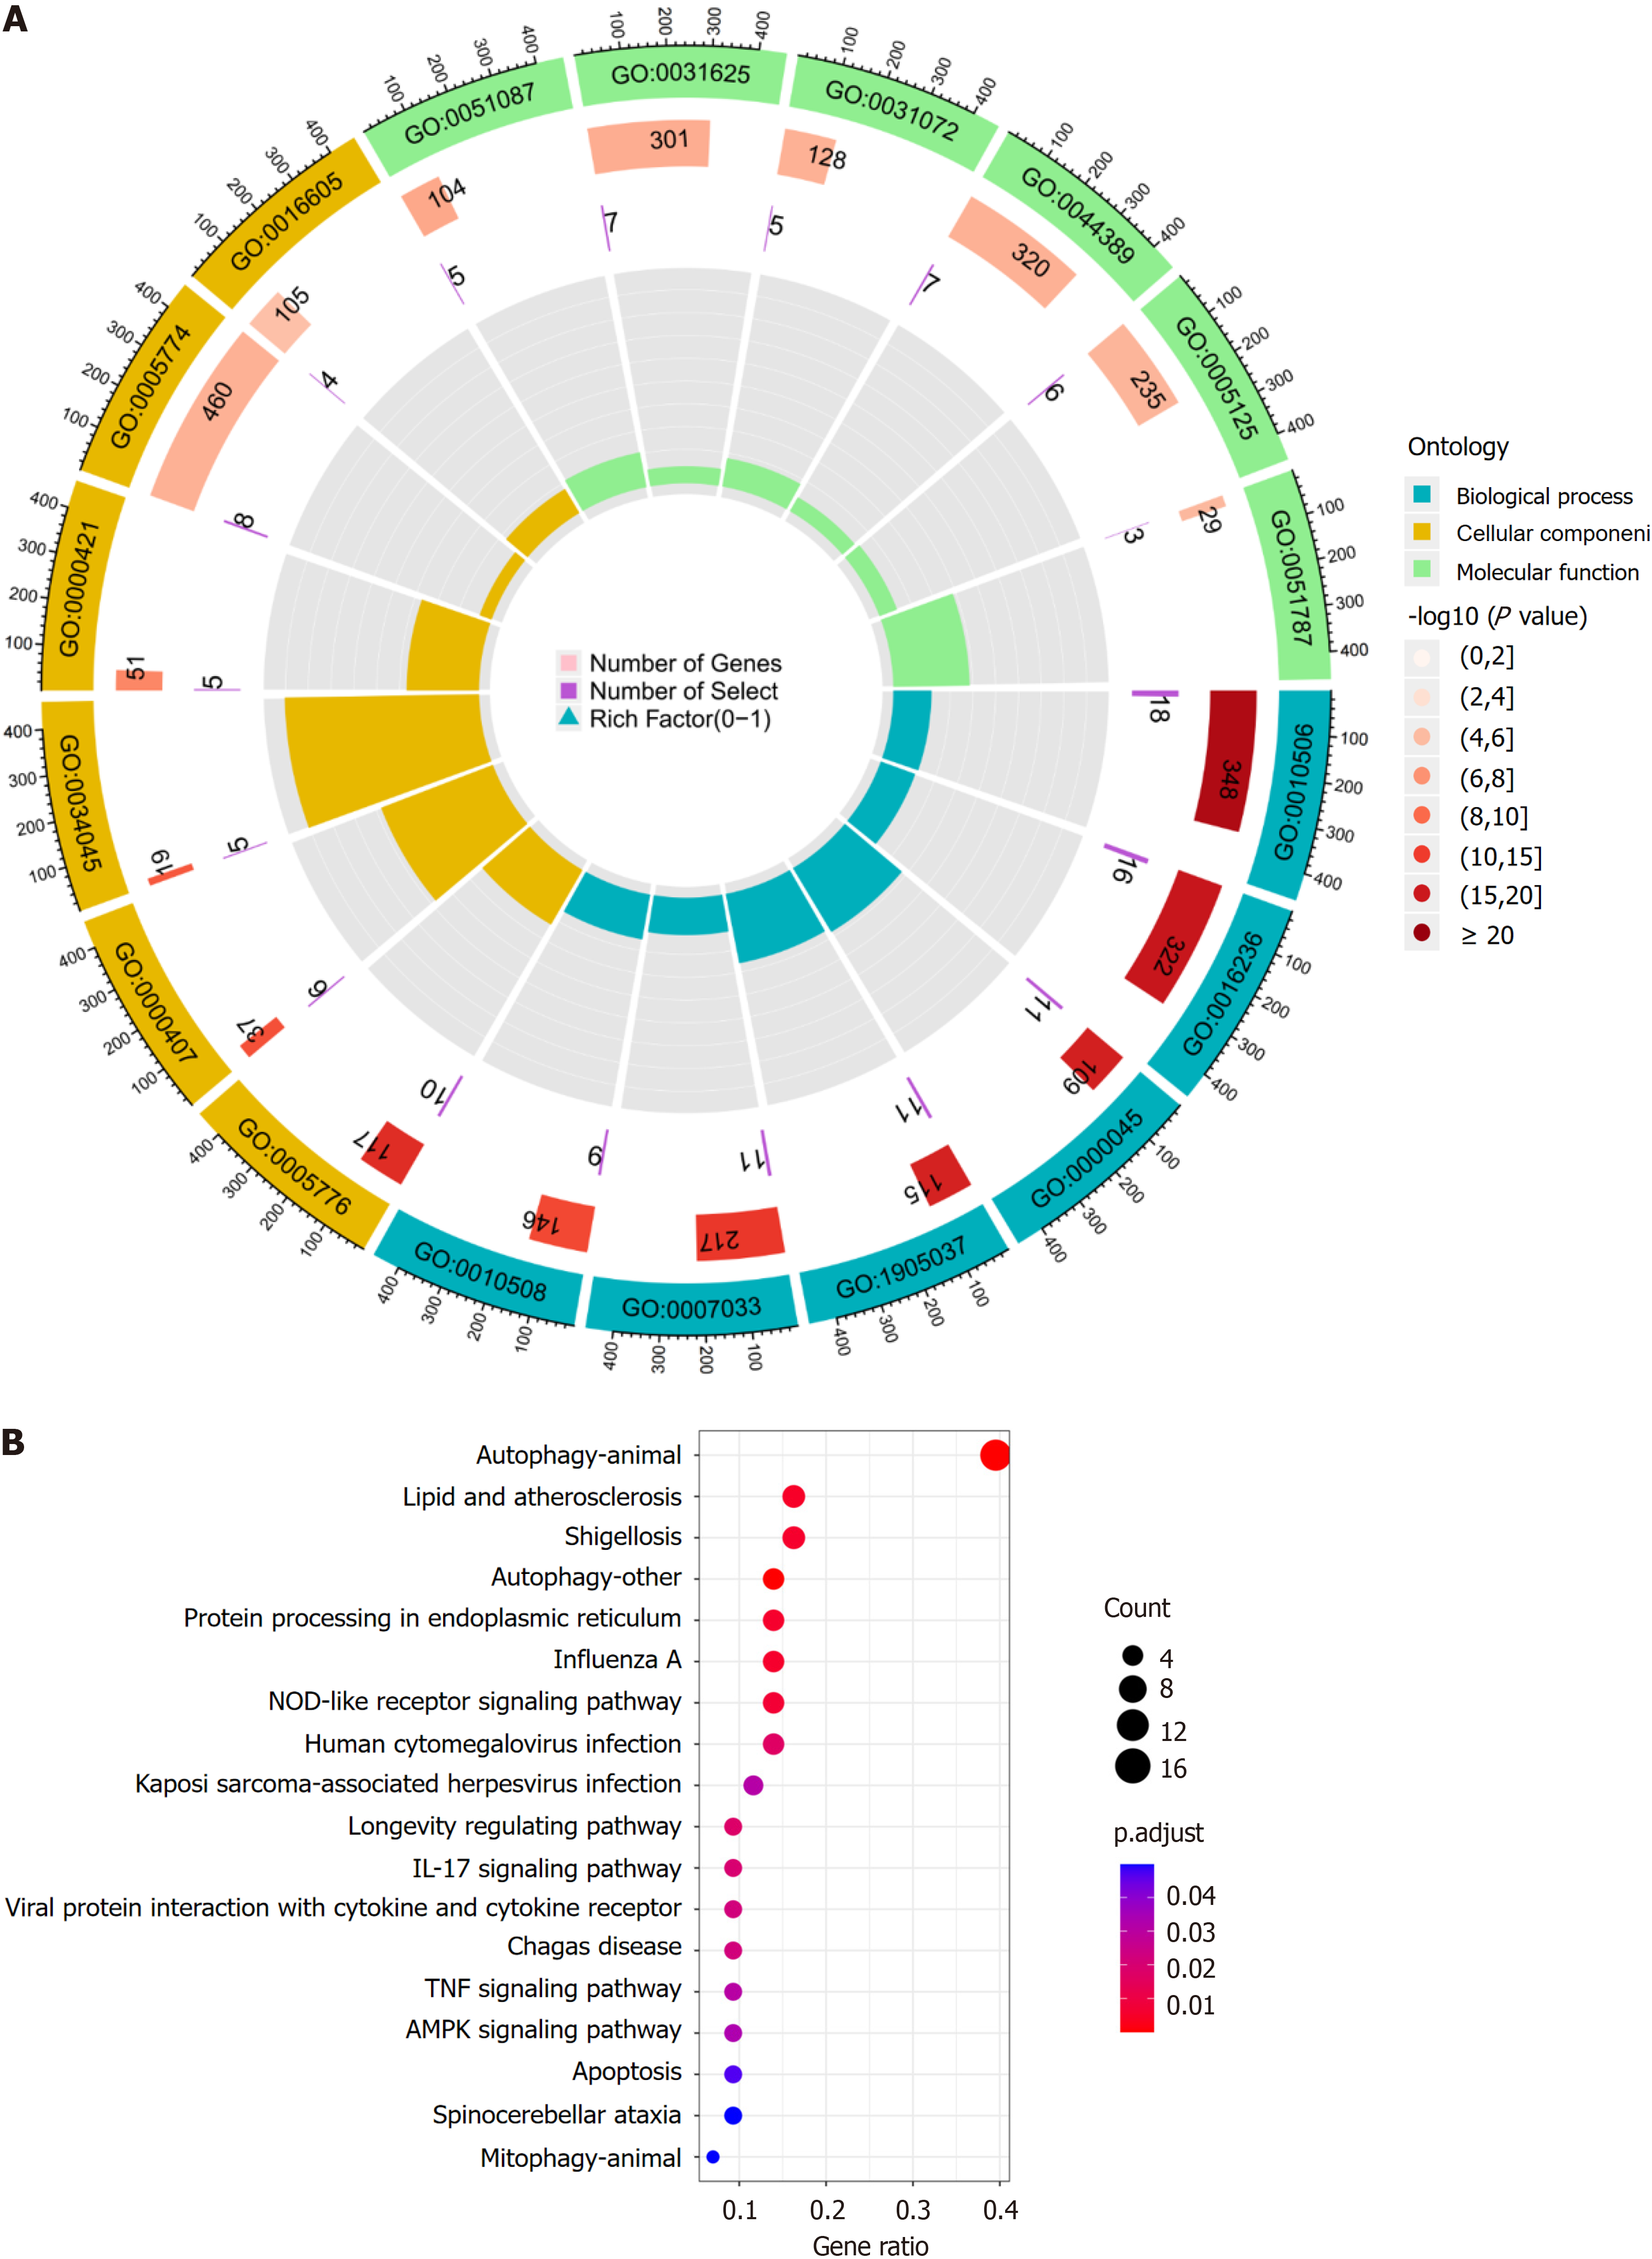
Figure 5 Results of gene ontology enrichment analysis.
A: The blue part represents biological processes, the yellow part represents cellular components and the green part represents molecular functions. the height of the bar in the inner circle is proportional to the degree of enrichment. Results of Kyoto Encyclopedia of Genes and Genomes enrichment analysis; B: The horizontal coordinate is the number of enriched differentially expressed autophagy-related genes and the color of the node changes from red to purple according to the adjustment.
- Citation: Gong ZZ, Li T, Yan H, Xu MH, Lian Y, Yang YX, Wei W, Liu T. Exploring the autophagy-related pathogenesis of active ulcerative colitis. World J Clin Cases 2024; 12(9): 1622-1633
- URL: https://www.wjgnet.com/2307-8960/full/v12/i9/1622.htm
- DOI: https://dx.doi.org/10.12998/wjcc.v12.i9.1622