Copyright
©The Author(s) 2024.
World J Clin Cases. Feb 16, 2024; 12(5): 891-902
Published online Feb 16, 2024. doi: 10.12998/wjcc.v12.i5.891
Published online Feb 16, 2024. doi: 10.12998/wjcc.v12.i5.891
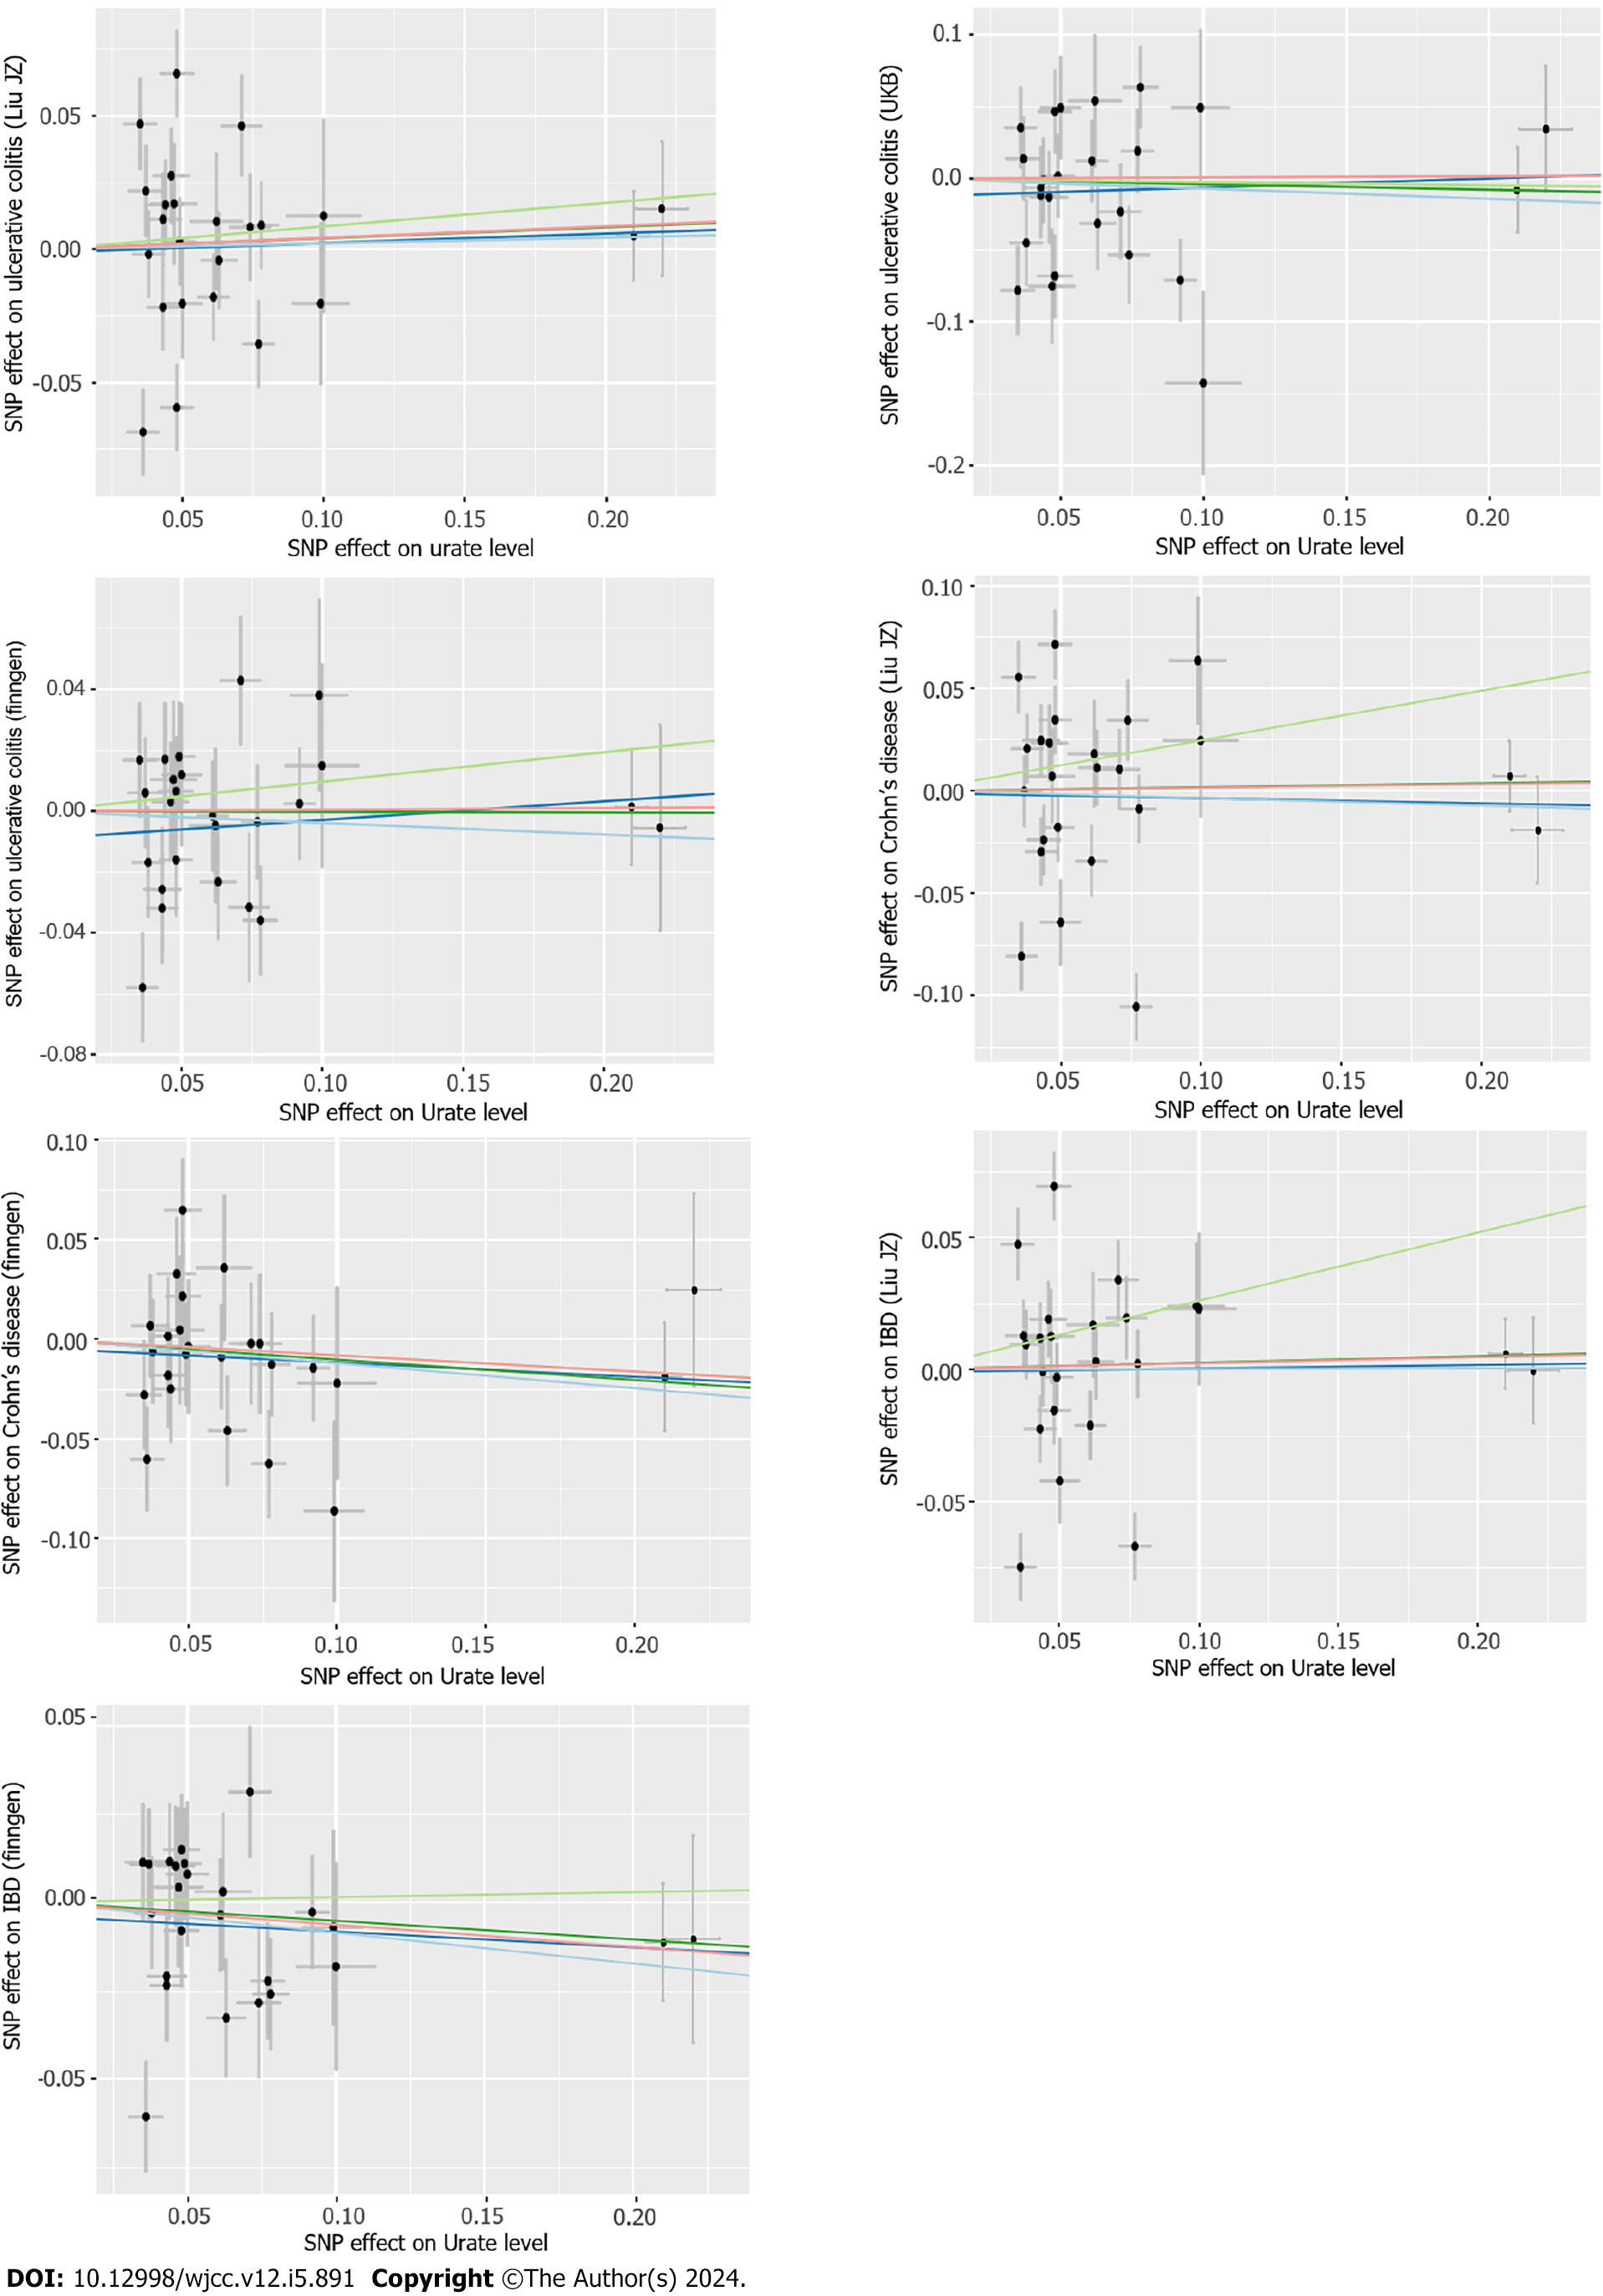
Figure 3 Scatter plot of Mendelian randomization analyses from urate levels to inflammatory bowel disease in each database.
The X-axes indicate the single-nucleotide polymorphisms (SNPs) of urate levels, while the Y-axes indicate the SNPs of inflammatory bowel disease from different outcome databases. The black dots represent the genetic instruments included in the current Mendelian randomization (MR) analyses. The five colors represent five different genetic estimates: Red: Inverse-variance weighted; Blue: Weighted-median estimator; Green: MR Egger. IBD: Inflammatory bowel disease; SNP: Single-nucleotide polymorphisms.
- Citation: Zhang S, Fang X, Kang L, Sui XY, Liu M, Luo YJ, Fu S, Li ZS, Zhao SB, Bai Y. Serum urate is associated with an increased risk of inflammatory bowel disease: A bidirectional Mendelian randomization study. World J Clin Cases 2024; 12(5): 891-902
- URL: https://www.wjgnet.com/2307-8960/full/v12/i5/891.htm
- DOI: https://dx.doi.org/10.12998/wjcc.v12.i5.891


