Copyright
©The Author(s) 2024.
World J Clin Cases. Feb 16, 2024; 12(5): 1029-1032
Published online Feb 16, 2024. doi: 10.12998/wjcc.v12.i5.1029
Published online Feb 16, 2024. doi: 10.12998/wjcc.v12.i5.1029
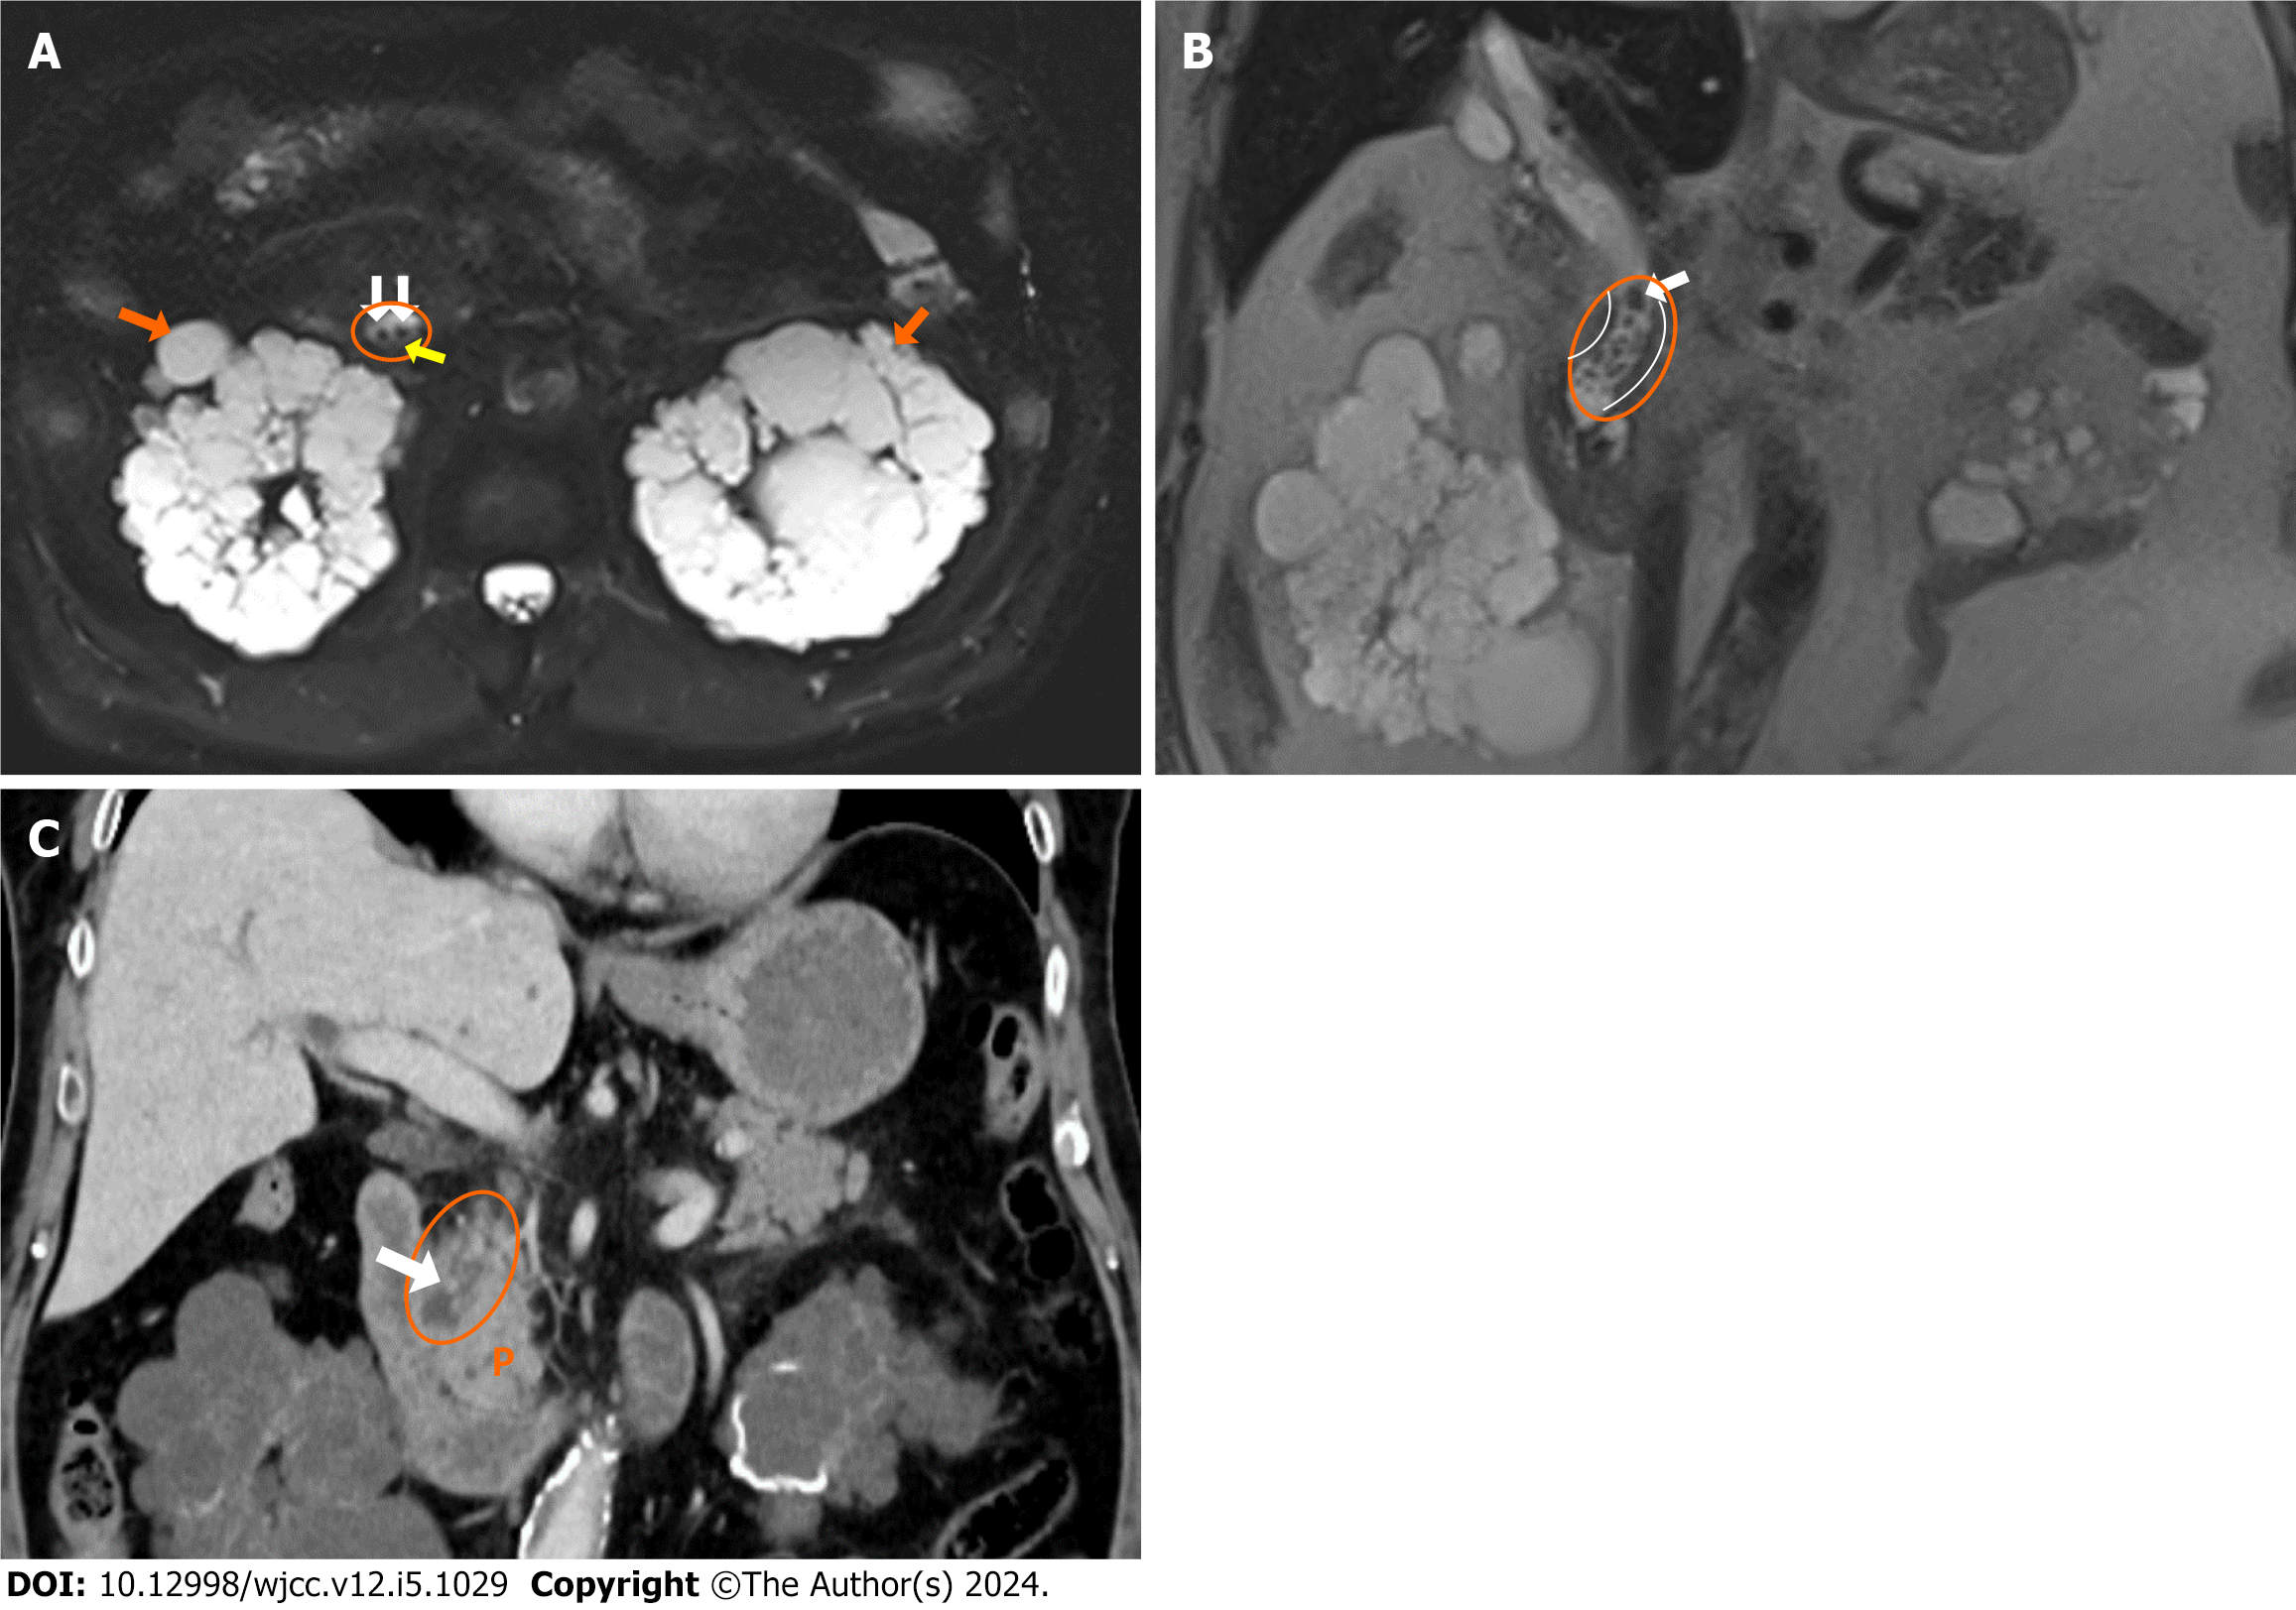
Figure 1 Choledochal obstruction caused by calculus.
A: Fat-suppressed T2 WI shows calculus (white arrows) in the dilated choledochal duct (circle) and bile sludge (orange arrow). The patient also has autosomal dominant polycystic kidney disease (orange arrows); B: HASTE coronal image shows calculus (white arrow) in the dilated choledochal duct (circle) with smooth borders (curved lines); C: Coronal computed tomography image shows a dilated choledochal duct (circle) with calculus (white arrow) P: Pancreas.
- Citation: Aydin S, Irgul B. Response letter to “Acute cholangitis: Does malignant biliary obstruction vs choledocholithiasis etiology change the outcomes?” with imaging aspects. World J Clin Cases 2024; 12(5): 1029-1032
- URL: https://www.wjgnet.com/2307-8960/full/v12/i5/1029.htm
- DOI: https://dx.doi.org/10.12998/wjcc.v12.i5.1029


