
















©The Author(s) 2024.
World J Clin Cases. Sep 6, 2024; 12(25): 5775-5783
Published online Sep 6, 2024. doi: 10.12998/wjcc.v12.i25.5775
Published online Sep 6, 2024. doi: 10.12998/wjcc.v12.i25.5775
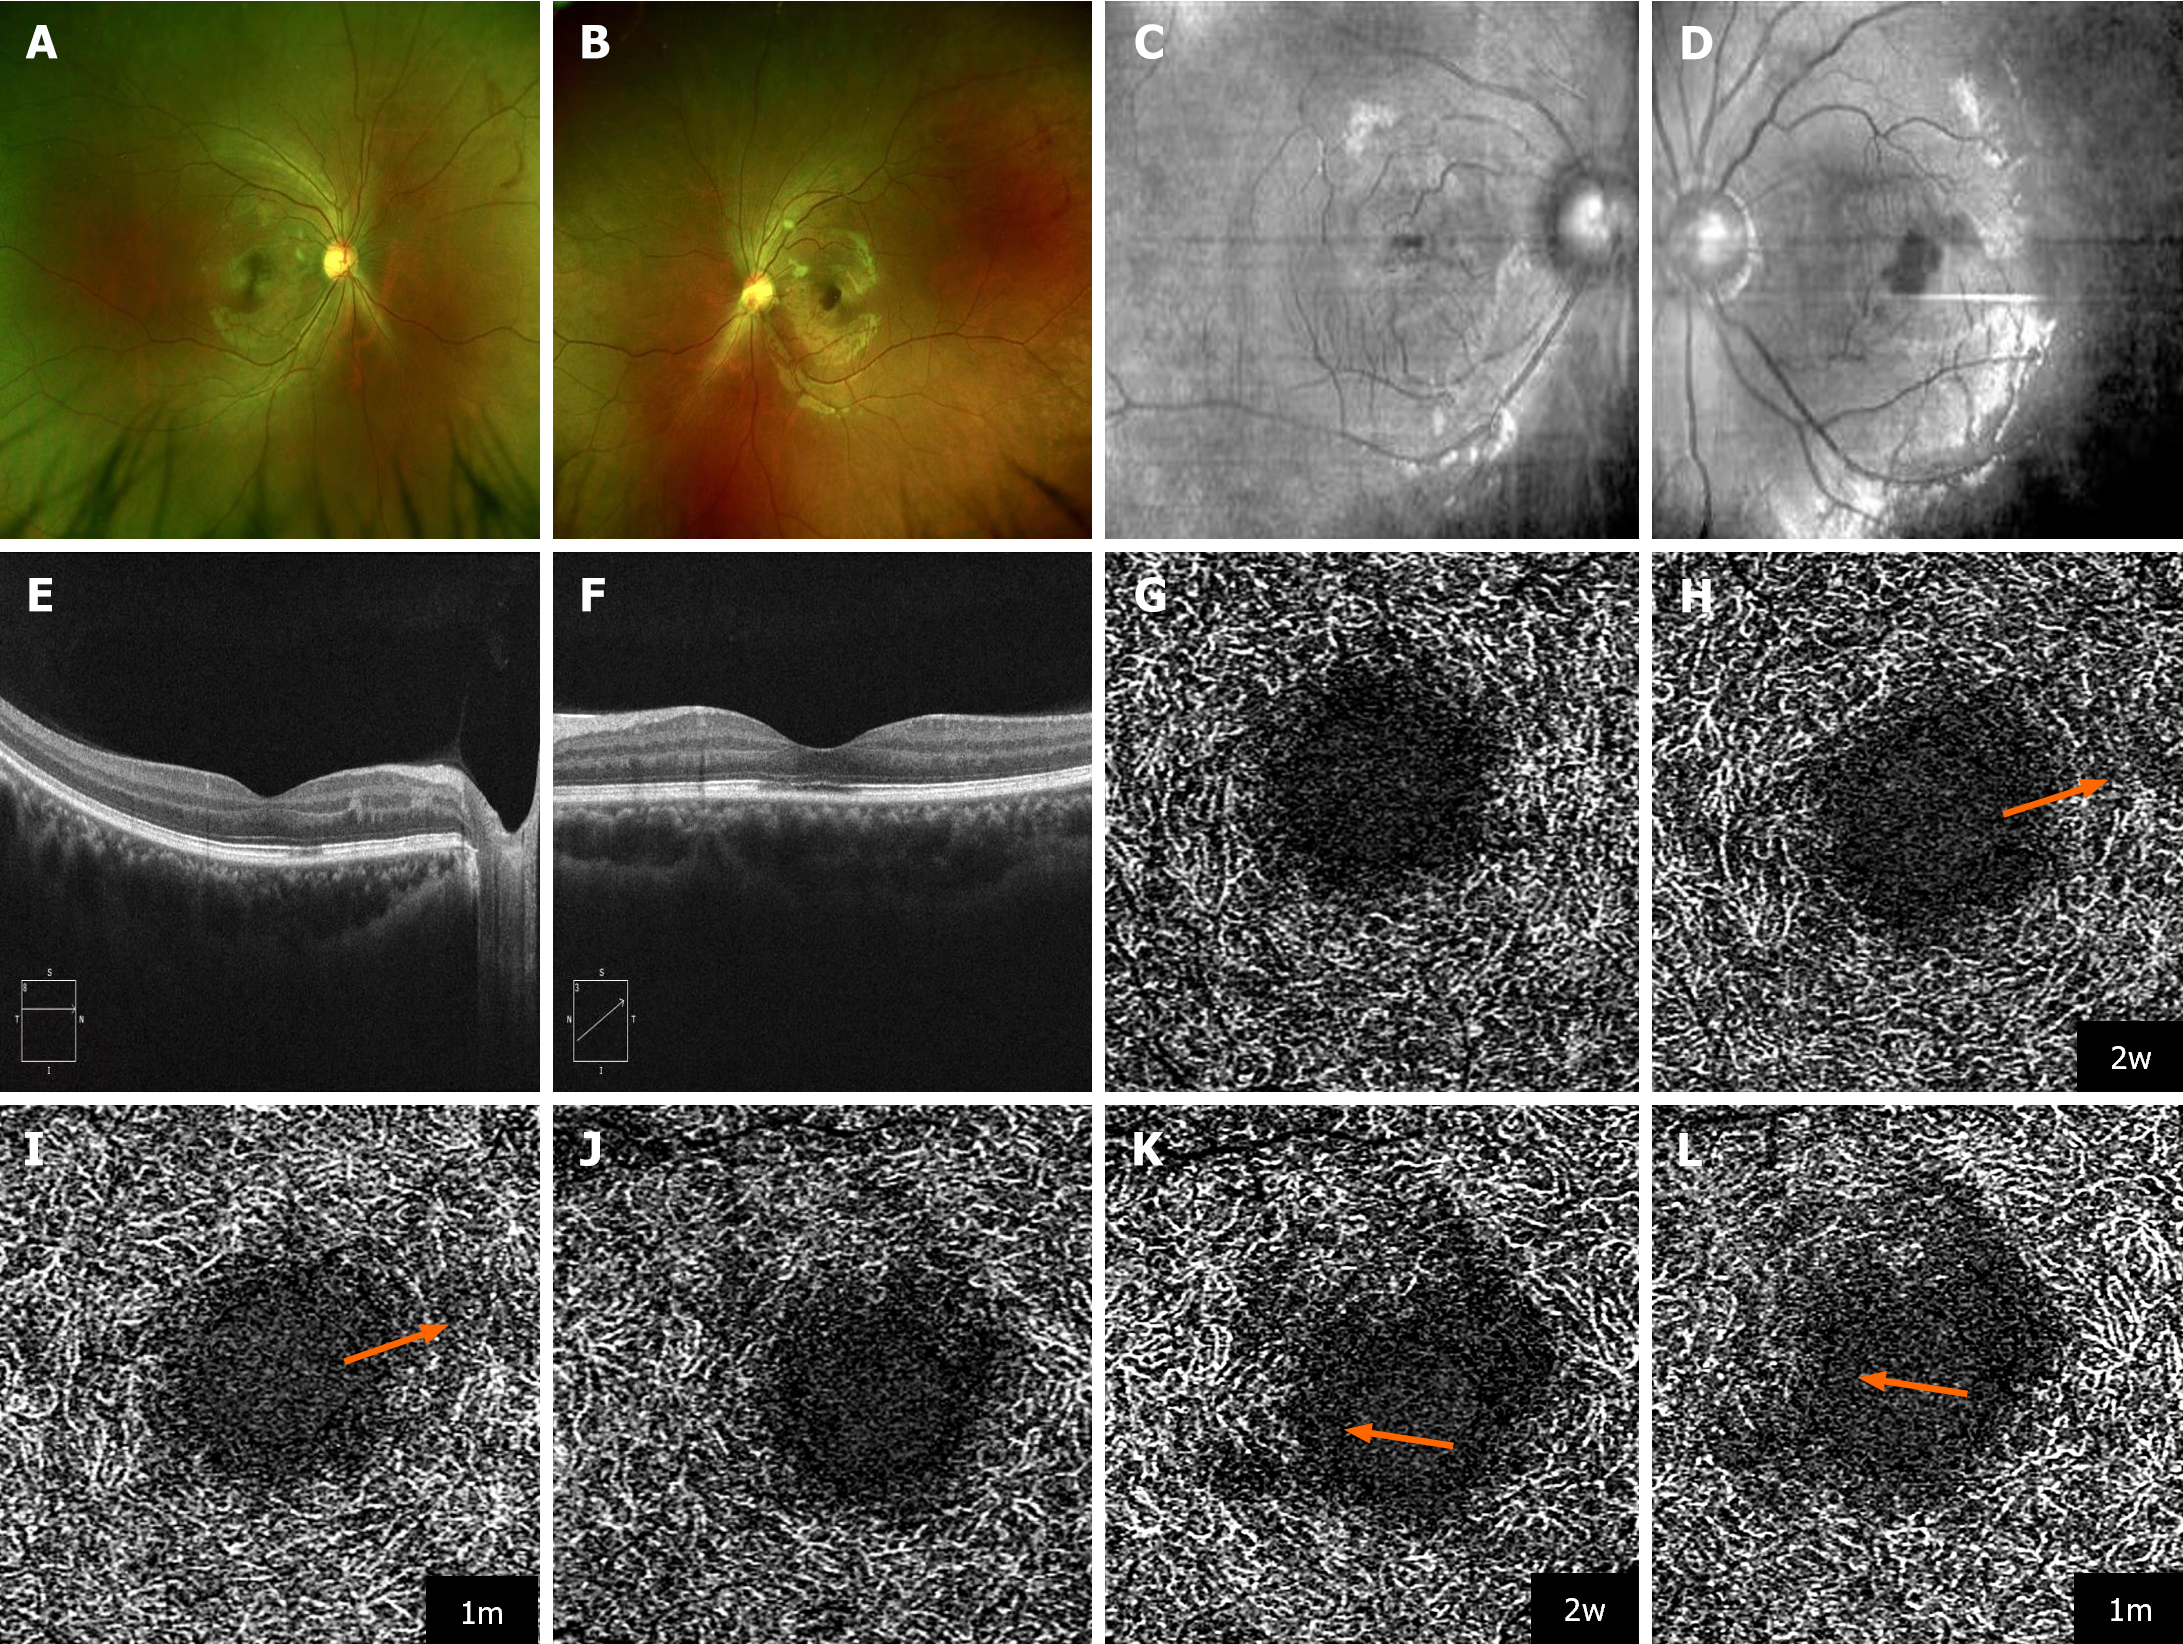
Figure 2 Multimodal imaging and deep capillary plexus flow signal evolution in acute macular neuroretinopathy in Case 2.
A and B: Ultrawide field pseudocolor fundus photography (Optos PLC, Dunfermline, Scotland, United Kingdom) shows scattered cotton-wool spots in both eyes; C and D. Near-infrared reflectance imaging shows hyporeflective lesions within the macular region; E and F. Optical coherence tomography (OCT) B-scans provide detailed visualization of hyperreflective foci within the outer plexiform layer and hyporeflective foci in the ellipsoid zone/interdigitation zone in both eyes, with additional hyperreflective foci observed in the inner nuclear layer of the right eye; G-I: Tracked OCT angiography (OCTA) (Plex Elite 9000; Carl Zeiss Meditec, Inc., Dublin, CA, United States), focused on the deep capillary plexus, reveals a gradual decrease in the flow signal (orange arrow) in the right eye in the follow-up period; J-L: Similar OCTA imaging of the deep capillary plexus for the left eye also shows progressive reduction in flow signal (orange arrow), underscoring the bilateral impact on vascular density over time.
- Citation: Bi C, Huang CM, Shi YQ, Huang C, Yu T. Acute macular neuroretinopathy following COVID-19 infection: Three case reports. World J Clin Cases 2024; 12(25): 5775-5783
- URL: https://www.wjgnet.com/2307-8960/full/v12/i25/5775.htm
- DOI: https://dx.doi.org/10.12998/wjcc.v12.i25.5775