
















©The Author(s) 2024.
World J Clin Cases. Aug 26, 2024; 12(24): 5568-5582
Published online Aug 26, 2024. doi: 10.12998/wjcc.v12.i24.5568
Published online Aug 26, 2024. doi: 10.12998/wjcc.v12.i24.5568
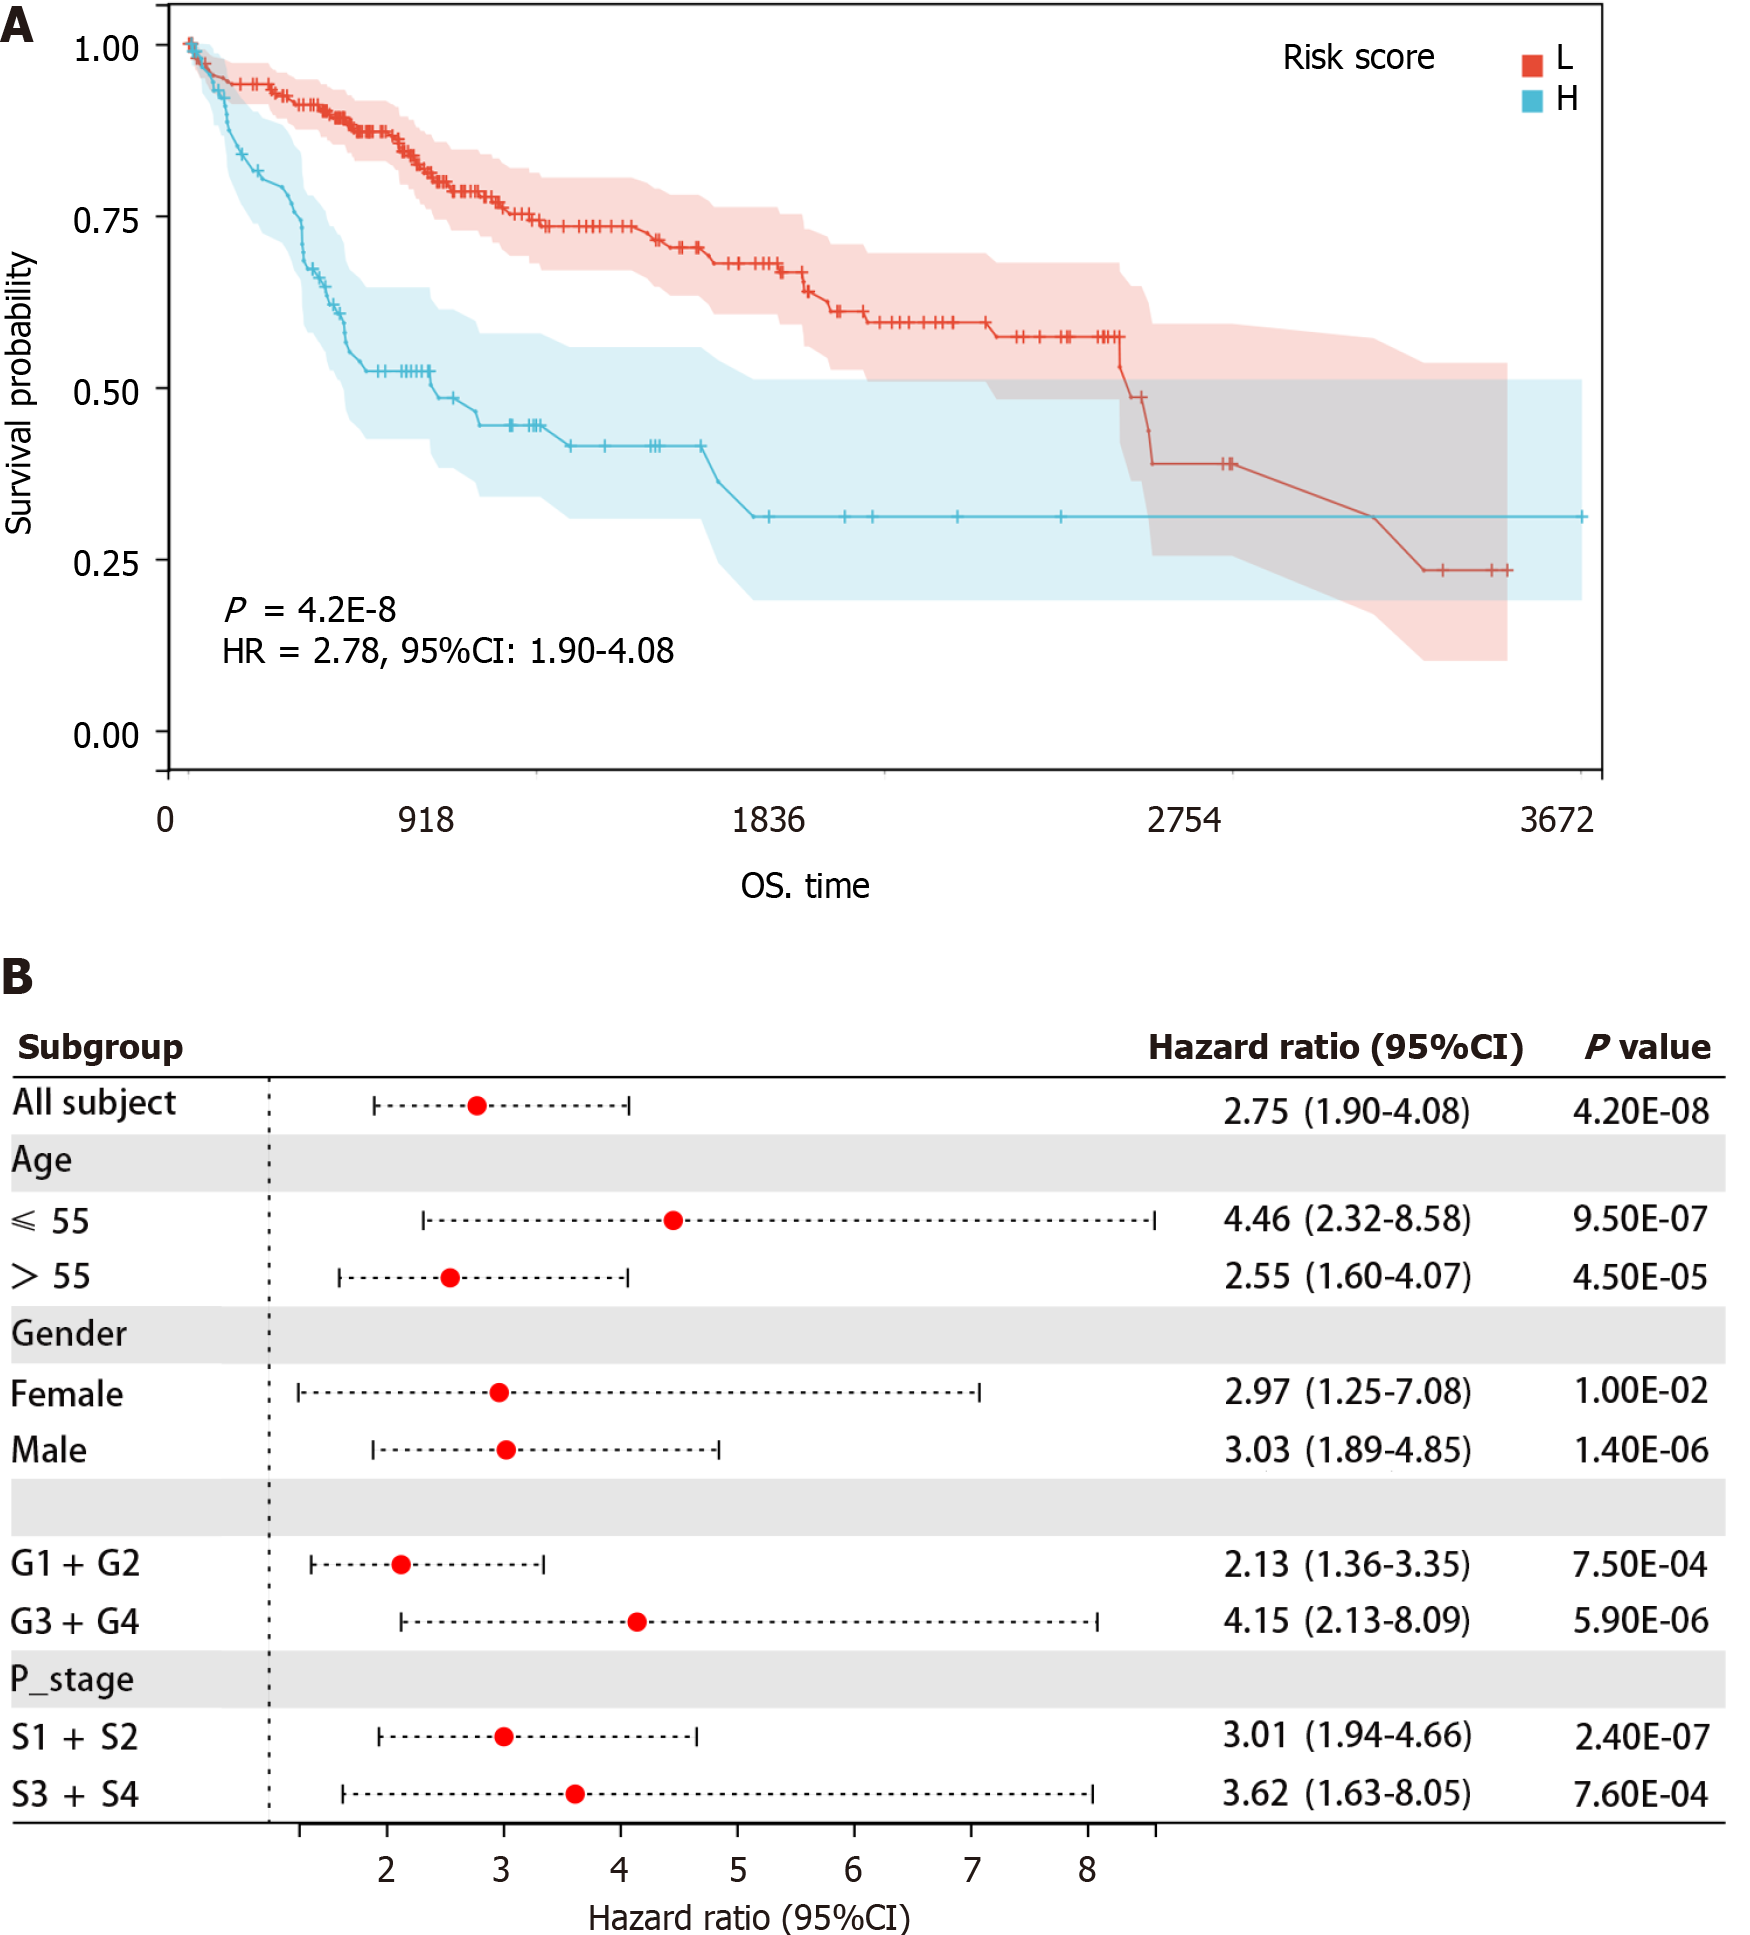
Figure 5 Prognostic model of the risk model.
A: Kaplan-Meier curve showed that a higher risk score was associated with poor prognosis; B: Correlation between risk scores in clinical features and hepatocellular carcinoma prognosis. S1 + S2: Stage I and stage II; S3 + S4: Stage III and stage IV. CI: Confidence interval; H: High; HR: Hazard ratio; L: Low; OS: Overall survival.
- Citation: Yu TY, Zhan ZJ, Lin Q, Huang ZH. Computed tomography-based radiomics predicts the fibroblast-related gene EZH2 expression level and survival of hepatocellular carcinoma. World J Clin Cases 2024; 12(24): 5568-5582
- URL: https://www.wjgnet.com/2307-8960/full/v12/i24/5568.htm
- DOI: https://dx.doi.org/10.12998/wjcc.v12.i24.5568