
















©The Author(s) 2024.
World J Clin Cases. Aug 6, 2024; 12(22): 4905-4912
Published online Aug 6, 2024. doi: 10.12998/wjcc.v12.i22.4905
Published online Aug 6, 2024. doi: 10.12998/wjcc.v12.i22.4905
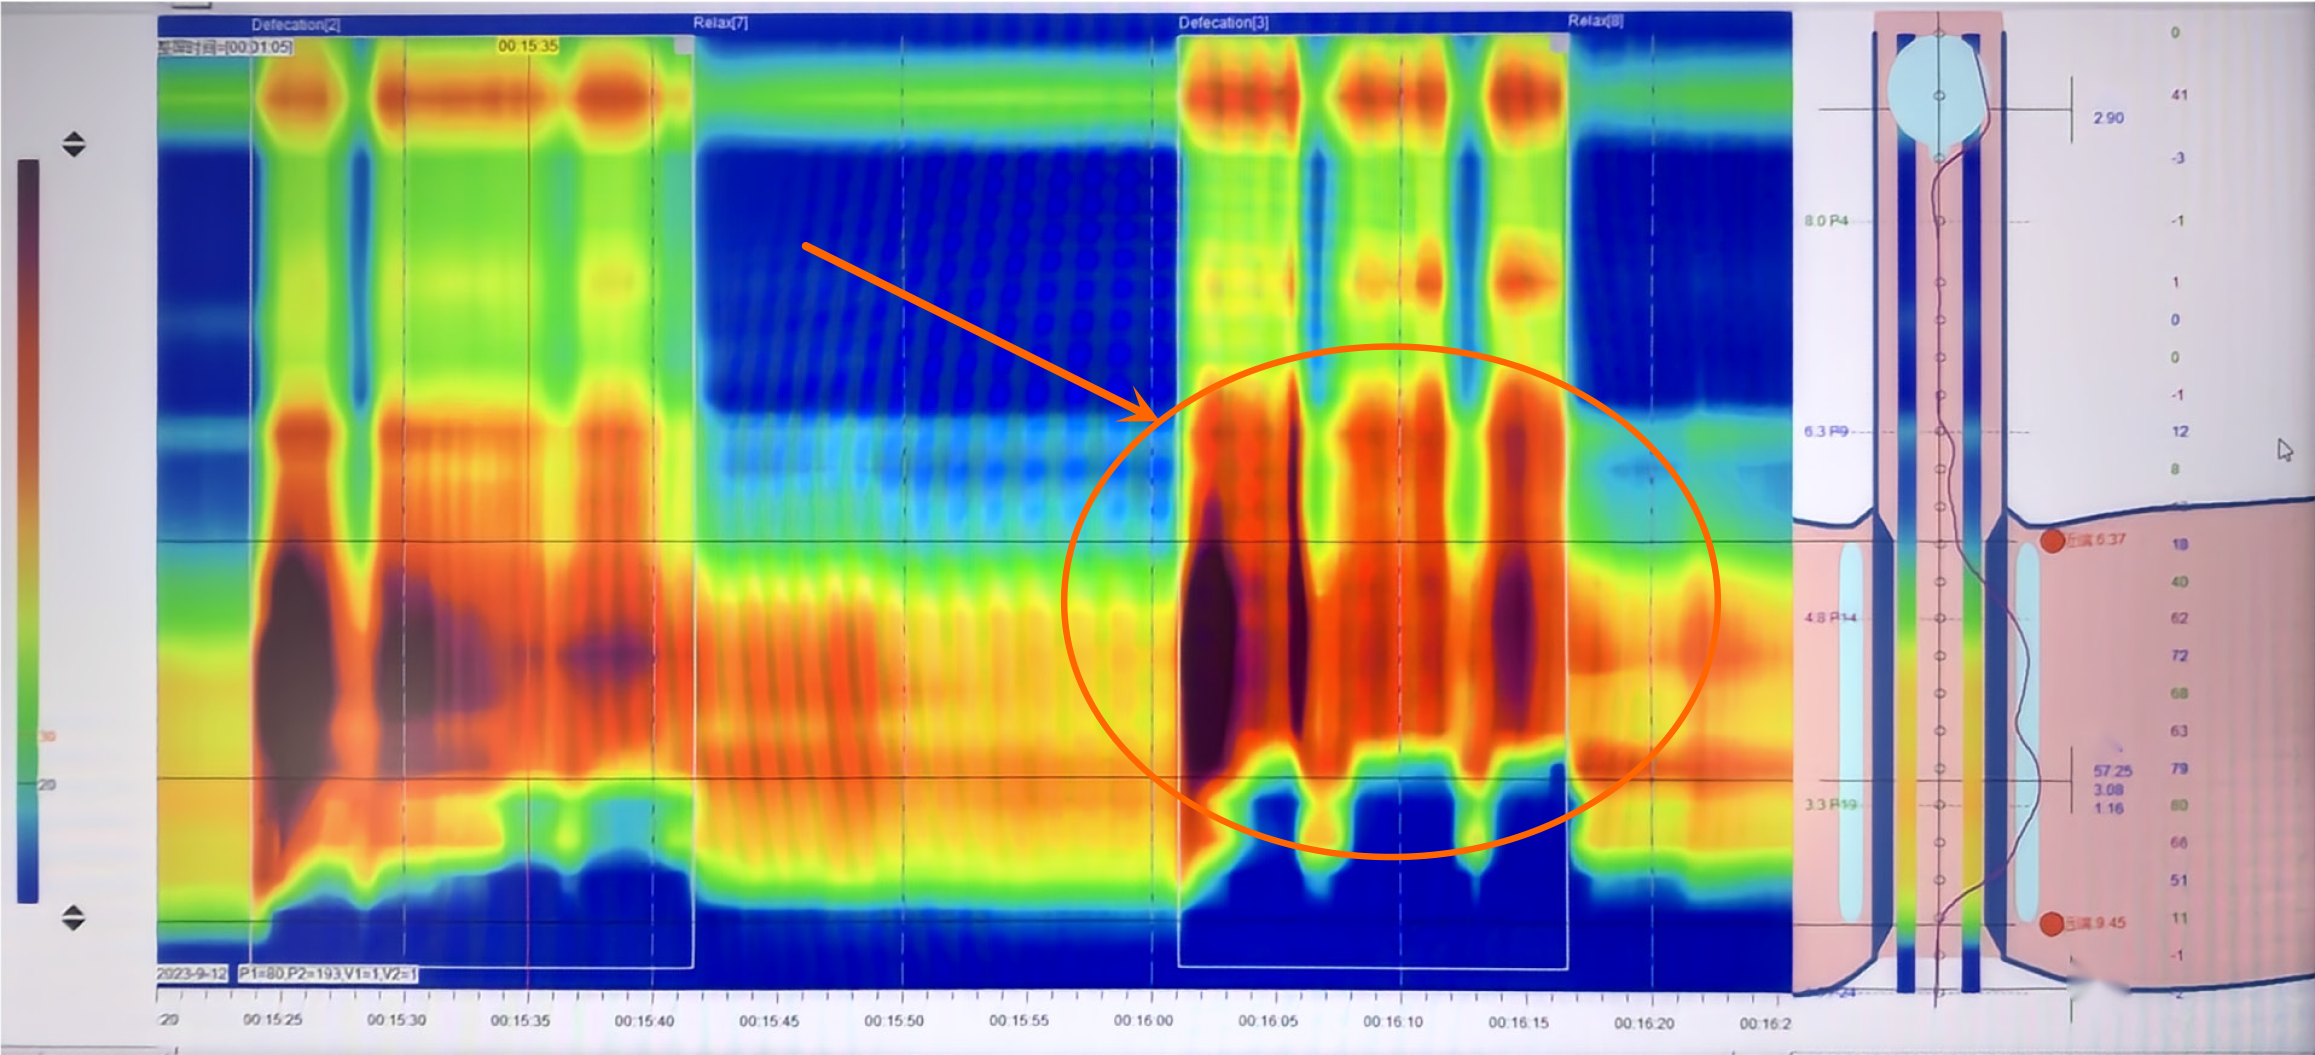
Figure 3 Anorectal pressure distribution map of patient during simulated defecation.
The red arrow indicates areas that simulate contradictory contractions during defecation where the anal sphincter cannot relax.
- Citation: Sun FF, Chen YQ, Jiang ZL, Ma L. Botulinum toxin type A injection combined with biofeedback in the treatment of spastic pelvic floor syndrome. World J Clin Cases 2024; 12(22): 4905-4912
- URL: https://www.wjgnet.com/2307-8960/full/v12/i22/4905.htm
- DOI: https://dx.doi.org/10.12998/wjcc.v12.i22.4905