
















©The Author(s) 2024.
World J Clin Cases. Jun 26, 2024; 12(18): 3505-3514
Published online Jun 26, 2024. doi: 10.12998/wjcc.v12.i18.3505
Published online Jun 26, 2024. doi: 10.12998/wjcc.v12.i18.3505
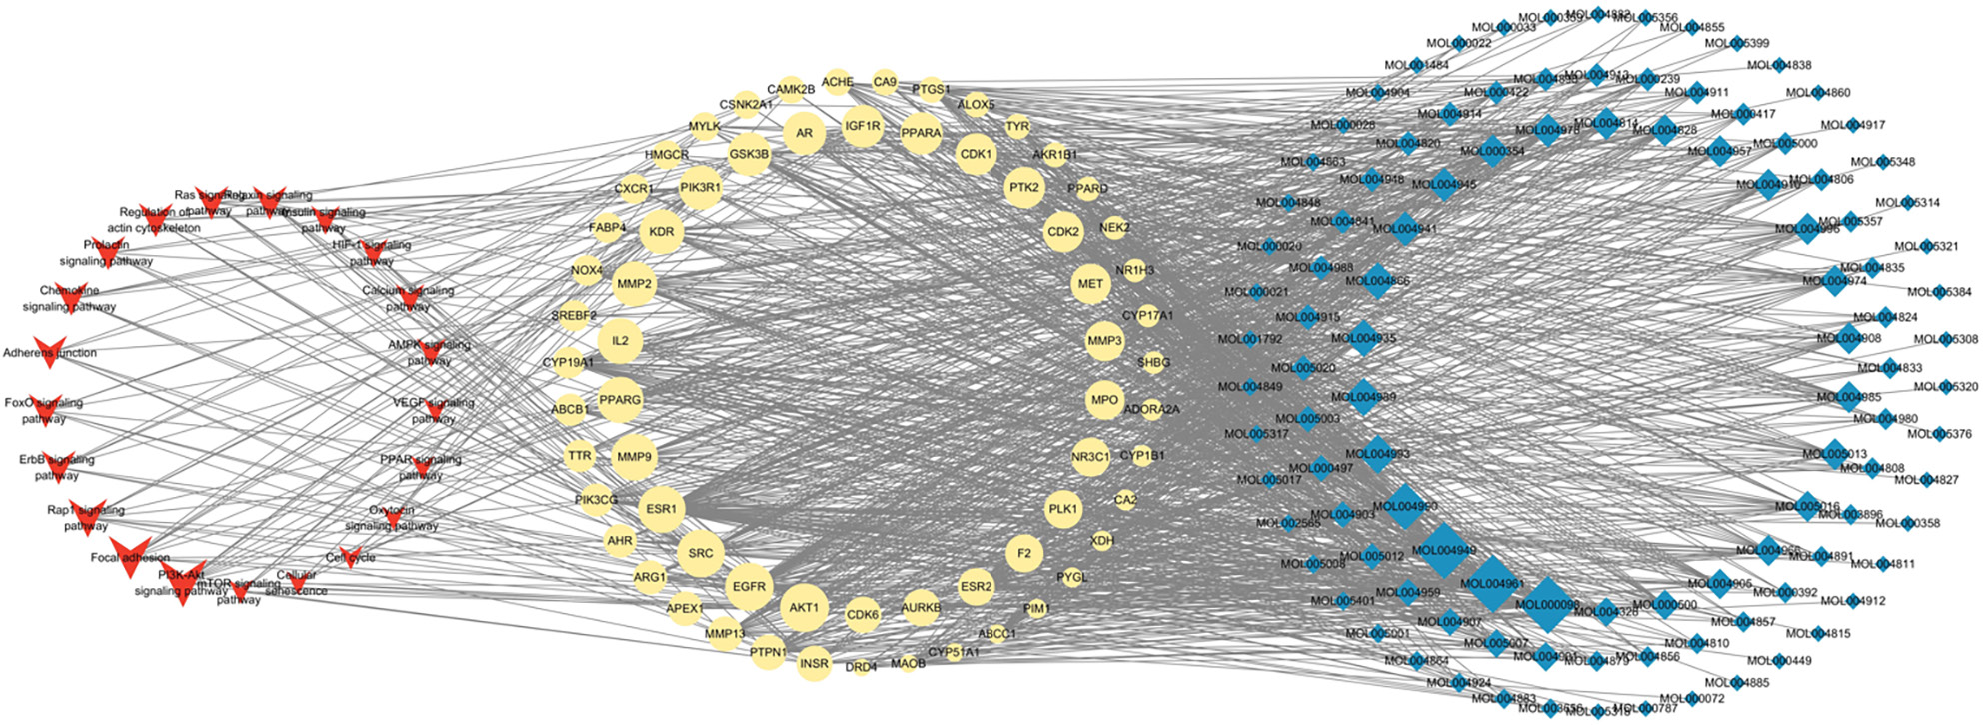
Figure 5 The topological network analysis among compounds, genes and pathways.
The red V was pathways; the yellow ellipse was genes; the blue diamond was compounds. The size of the red V, yellow ellipse and blue diamond were gradually and respectively changed according to the related gene numbers, degree and EC value, with larger size indicating a higher value.
- Citation: Zhang SY, Guo SX, Chen LL, Zhu JY, Hou MS, Lu JK, Shen XX. Exploring the potential mechanism of WuFuYin against hypertrophic scar using network pharmacology and molecular docking. World J Clin Cases 2024; 12(18): 3505-3514
- URL: https://www.wjgnet.com/2307-8960/full/v12/i18/3505.htm
- DOI: https://dx.doi.org/10.12998/wjcc.v12.i18.3505