Copyright
©The Author(s) 2023.
World J Clin Cases. Jan 26, 2023; 11(3): 692-699
Published online Jan 26, 2023. doi: 10.12998/wjcc.v11.i3.692
Published online Jan 26, 2023. doi: 10.12998/wjcc.v11.i3.692
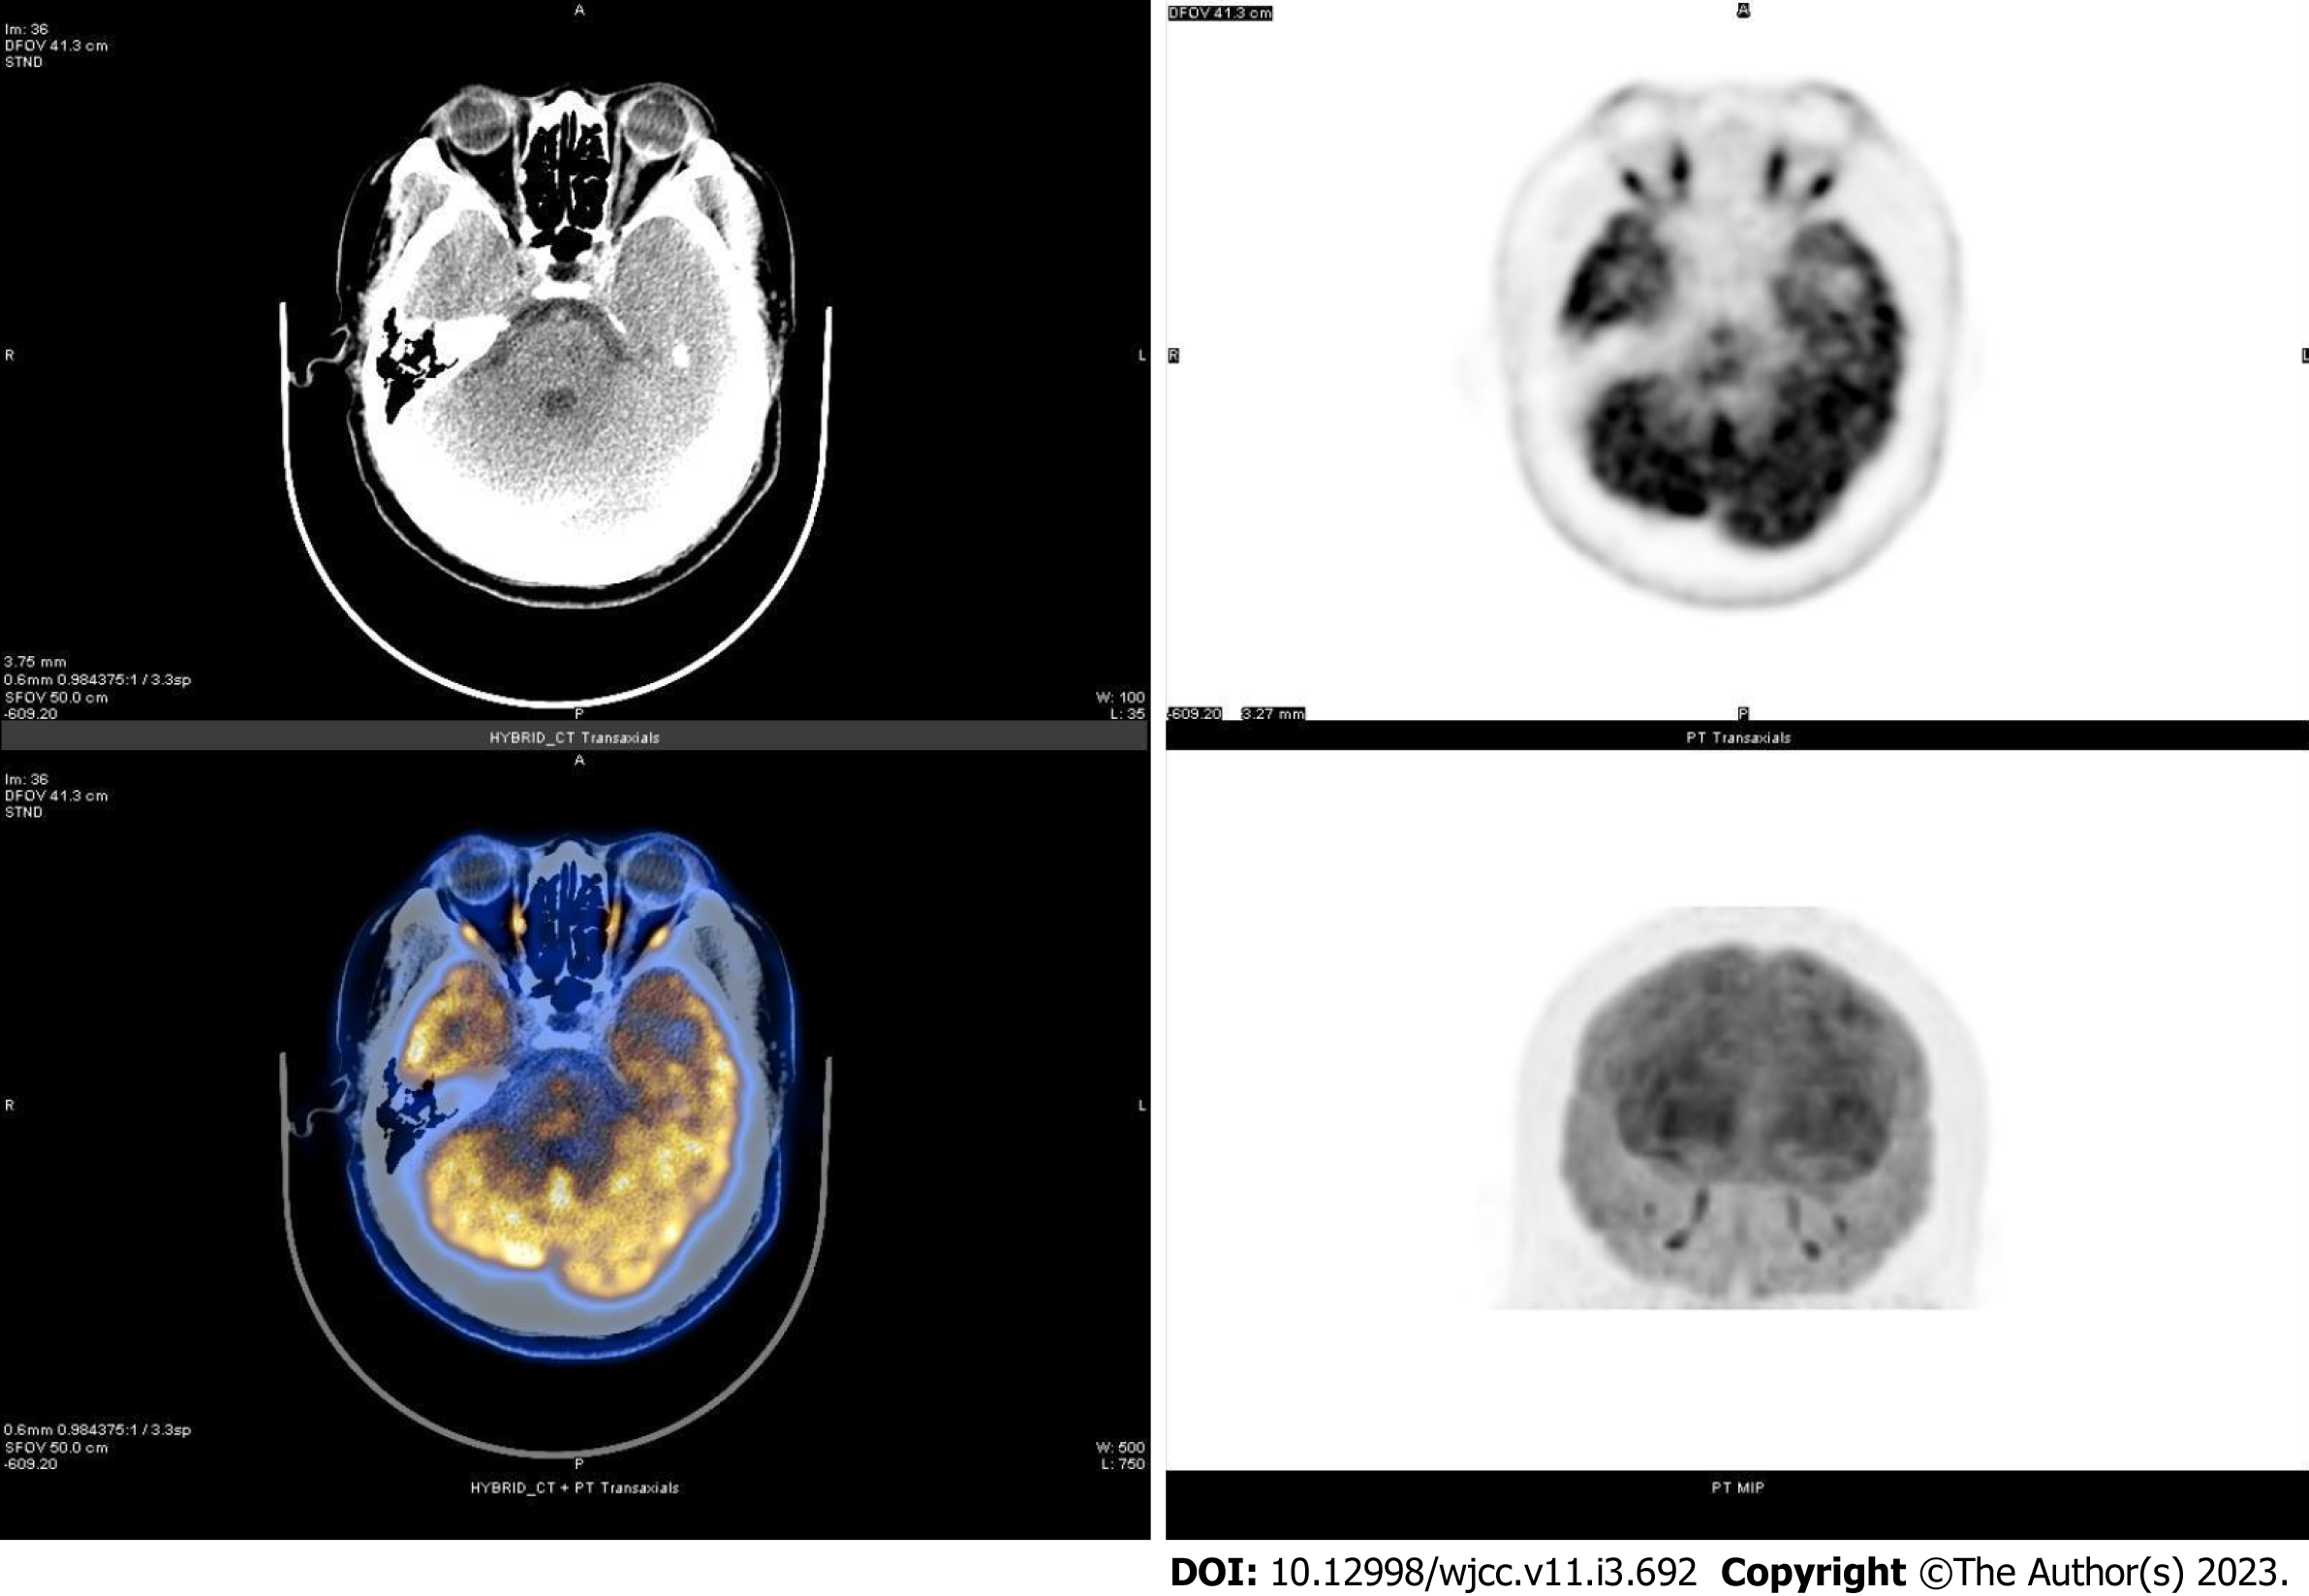
Figure 3 Transaxial computed tomography image, transaxial and coronal positron emission tomography metabolograms, color fusion map of positron emission tomography / computed tomography images at the orbital level.
The transaxial computed tomography (CT) image at the orbital level showed a patchy slightly hyperdense lesion. The transaxial positron emission tomography (PET) metabologram, coronal PET metabologram and PET/CT color fusion map at the orbital level showed no metabolic changes, and its SUVmax was 50.9.
- Citation: Tang X, Ji HM, Li WW, Ding ZX, Ye SL. Imaging features of retinal hemangioblastoma: A case report. World J Clin Cases 2023; 11(3): 692-699
- URL: https://www.wjgnet.com/2307-8960/full/v11/i3/692.htm
- DOI: https://dx.doi.org/10.12998/wjcc.v11.i3.692


