Copyright
©The Author(s) 2023.
World J Clin Cases. Sep 26, 2023; 11(27): 6631-6639
Published online Sep 26, 2023. doi: 10.12998/wjcc.v11.i27.6631
Published online Sep 26, 2023. doi: 10.12998/wjcc.v11.i27.6631
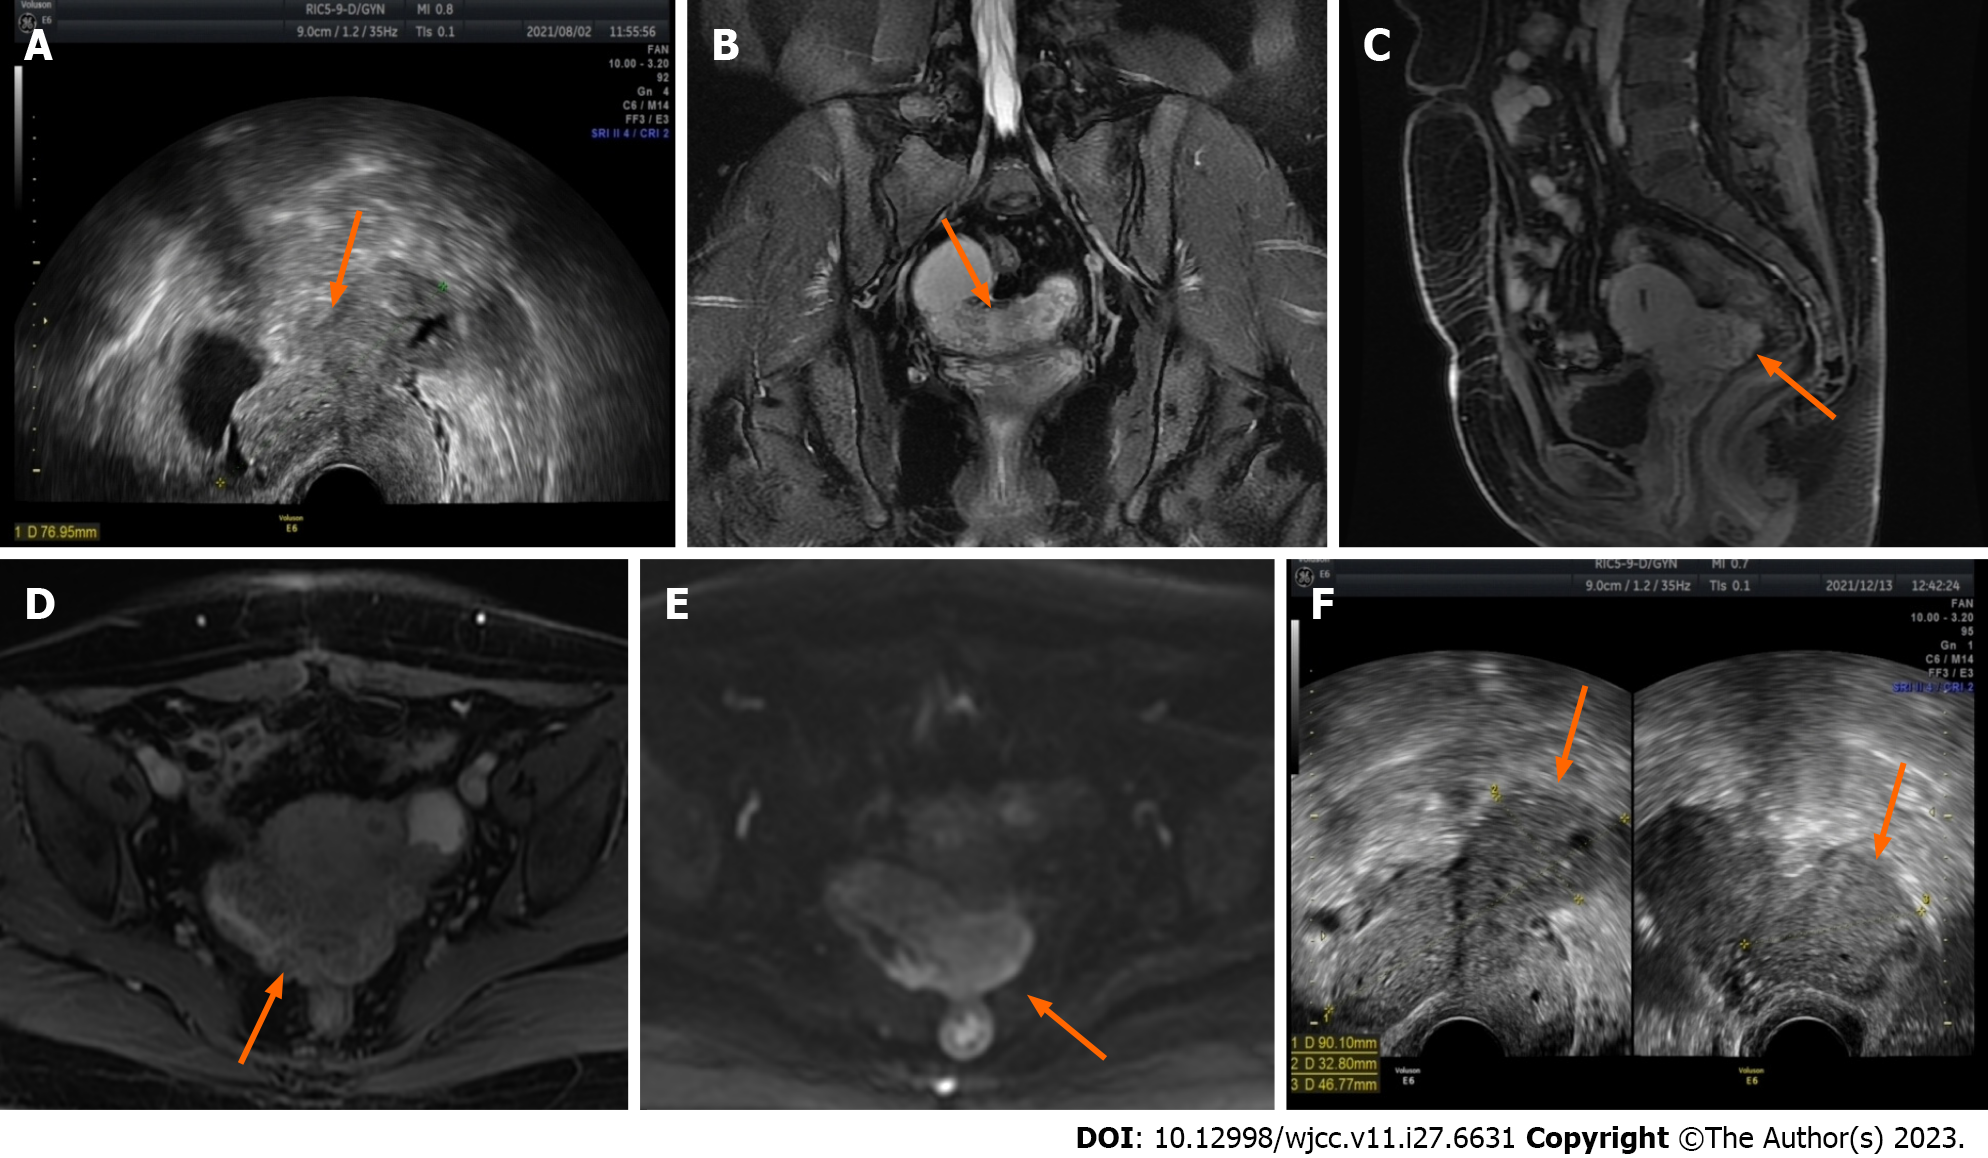
Figure 1 Ultrasound and magnetic resonance imaging images demonstrate changes in lesions before and after two cycles of gonadotropin-releasing hormone agonist treatment.
A: Before the start of treatment, the largest lesion measured 7.7 cm in diameter and displayed some hypoechoic regions within (ultrasound image) (orange arrow); B The lesion appears as slightly hyperintense on T2-weighted imaging in the coronal plane (magnetic resonance imaging) (orange arrow); C and D: In the sagittal and axial enhanced scans, uneven enhancement is observed (magnetic resonance imaging) (orange arrow); E: The lesion exhibits a slight increase in the diffusion-weighted imaging signal (magnetic resonance imaging) (orange arrow); F: After two courses of gonadotropin-releasing hormone agonist treatment, the maximum diameter of the lesion increased to 9 cm, with a few hypoechoic areas visible inside (ultrasound image) (orange arrow).
- Citation: Zhang DY, Peng C, Huang Y, Cao JC, Zhou YF. Rapidly growing extensive polypoid endometriosis after gonadotropin-releasing hormone agonist discontinuation: A case report. World J Clin Cases 2023; 11(27): 6631-6639
- URL: https://www.wjgnet.com/2307-8960/full/v11/i27/6631.htm
- DOI: https://dx.doi.org/10.12998/wjcc.v11.i27.6631


