Copyright
©The Author(s) 2023.
World J Clin Cases. Jul 16, 2023; 11(20): 4833-4842
Published online Jul 16, 2023. doi: 10.12998/wjcc.v11.i20.4833
Published online Jul 16, 2023. doi: 10.12998/wjcc.v11.i20.4833
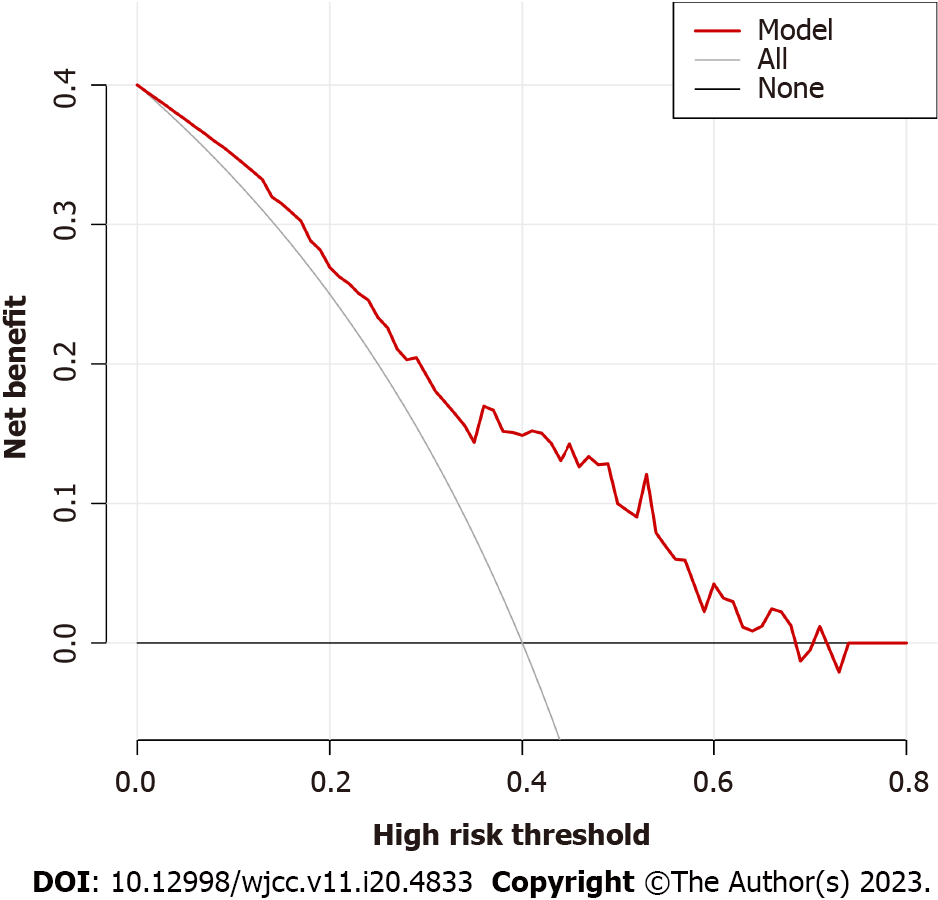
Figure 3 Decision curve analysis of the model.
The thin solid line represented the hypothesis that all patients were infected with Gram-positive bacteria, and the thick solid line represented the hypothesis that no patient was infected with Gram-positive bacteria. The Y-axis denoted the net benefit, which is positive from 0% to 68%.
- Citation: Zhang W, Chen T, Chen HJ, Chen N, Xing ZX, Fu XY. Risk prediction model for distinguishing Gram-positive from Gram-negative bacteremia based on age and cytokine levels: A retrospective study. World J Clin Cases 2023; 11(20): 4833-4842
- URL: https://www.wjgnet.com/2307-8960/full/v11/i20/4833.htm
- DOI: https://dx.doi.org/10.12998/wjcc.v11.i20.4833


