Copyright
©The Author(s) 2023.
World J Clin Cases. Jun 26, 2023; 11(18): 4377-4383
Published online Jun 26, 2023. doi: 10.12998/wjcc.v11.i18.4377
Published online Jun 26, 2023. doi: 10.12998/wjcc.v11.i18.4377
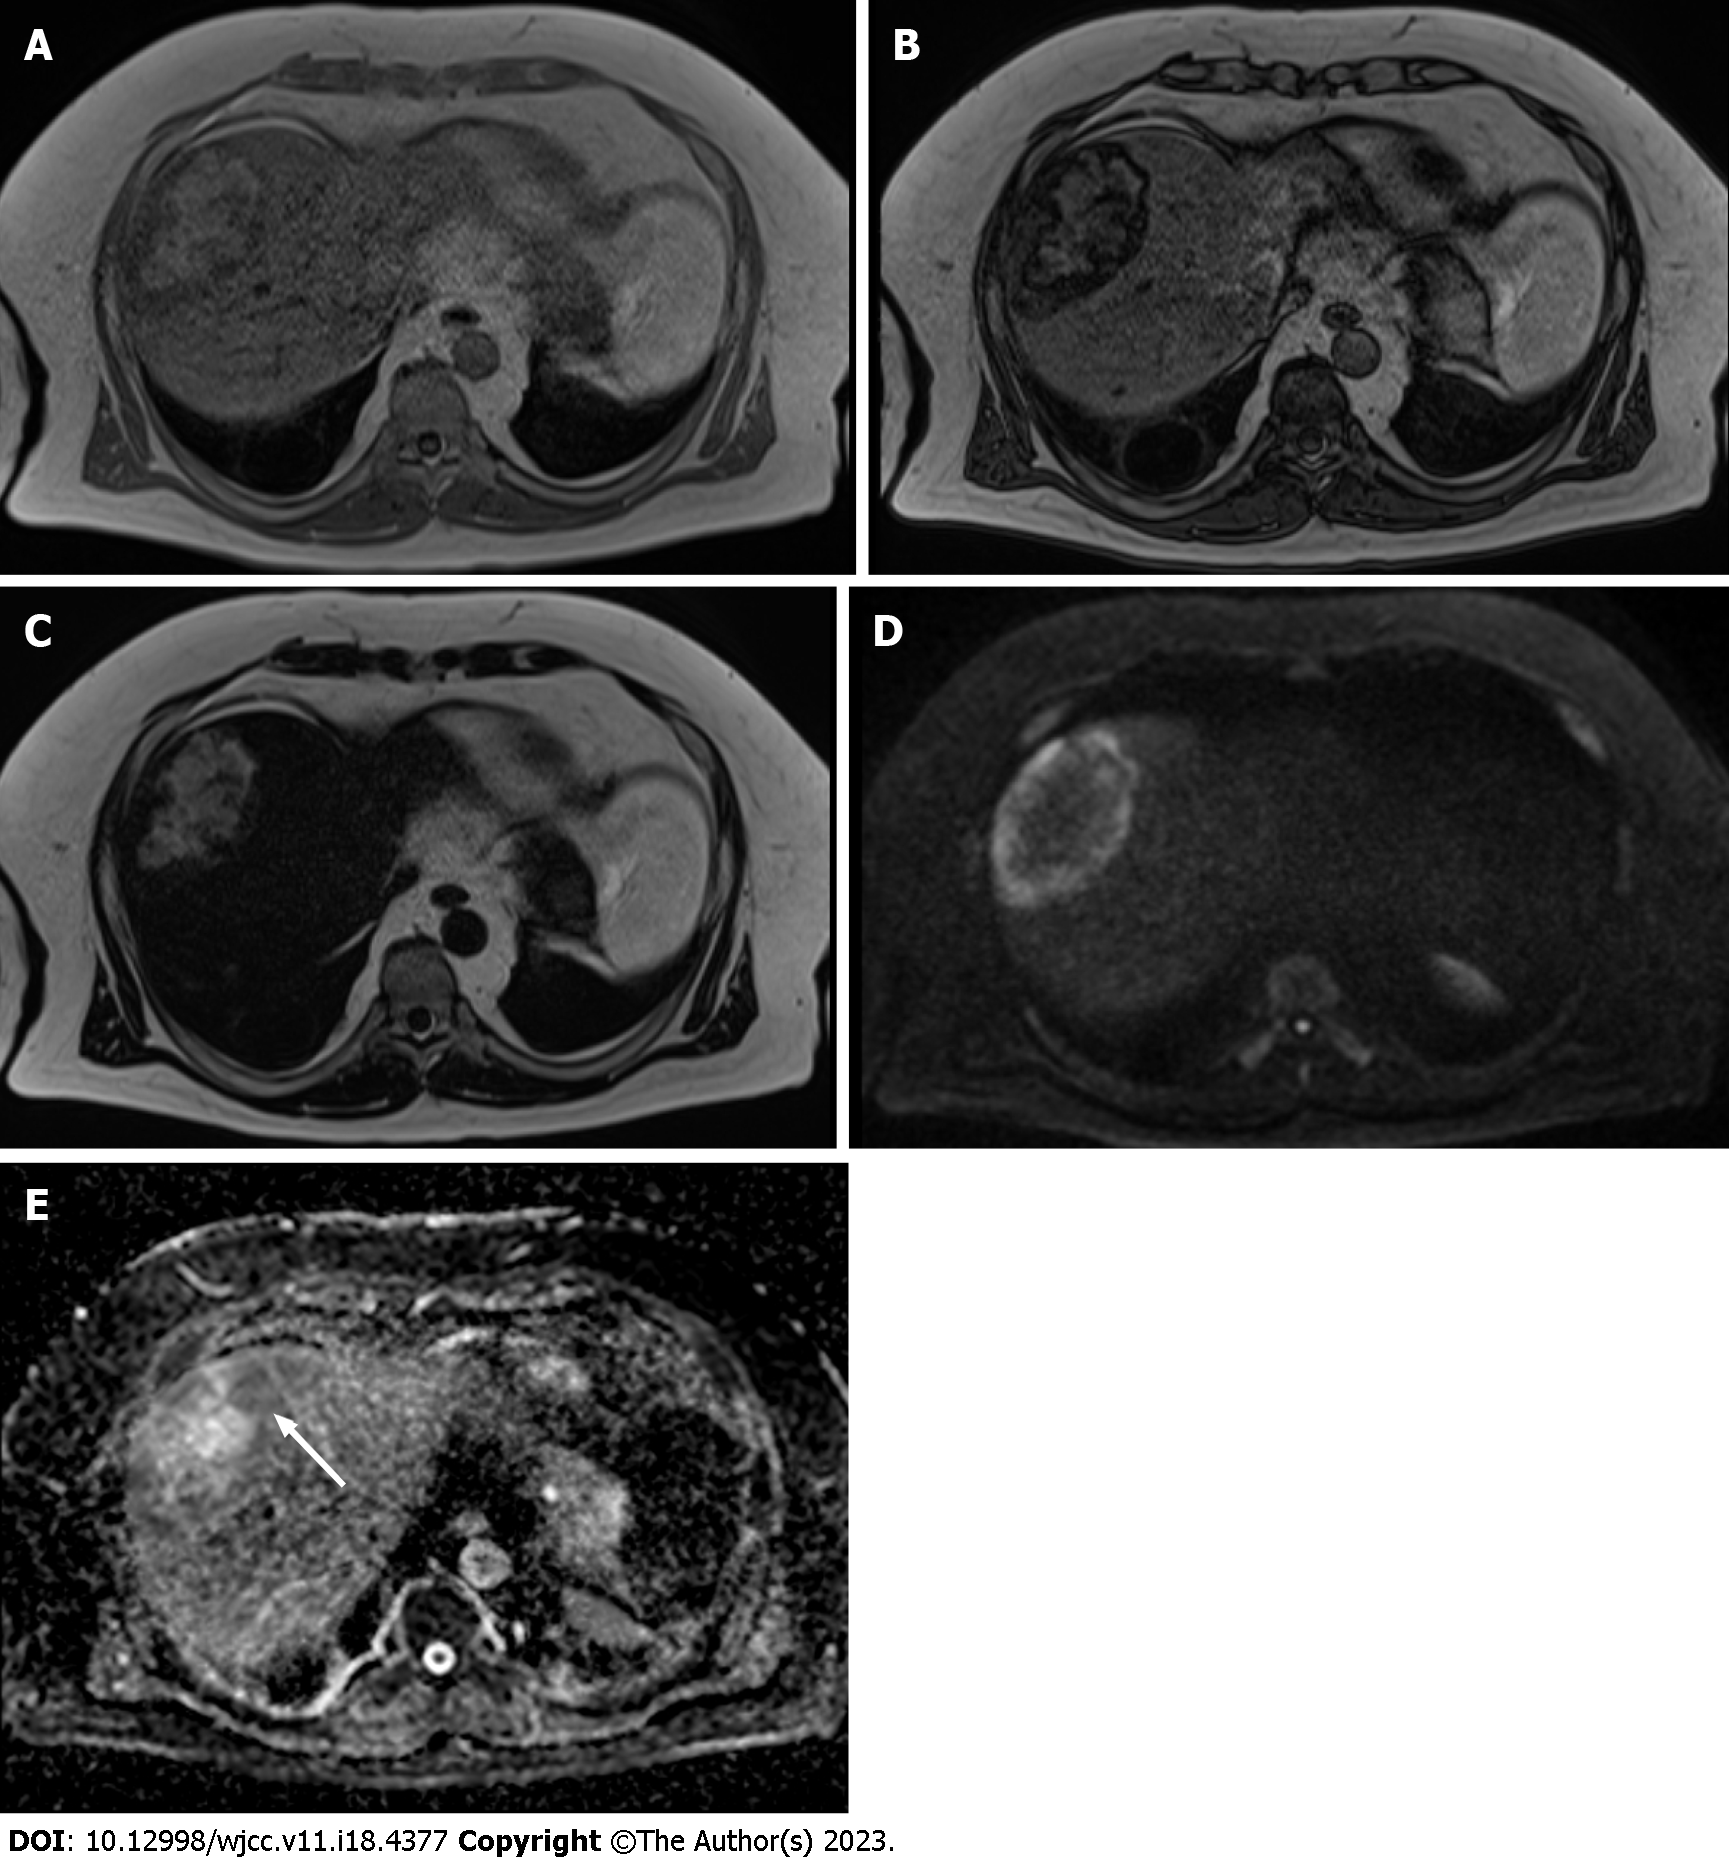
Figure 3 Plain magnetic resonance imaging.
A: T1-weighted in phase image shows hyperintensity at the center area and hypointensity at the peripheral area of the lesion compared with the background liver parenchyma; B: T1-weighted opposed phase image demonstrates an apparent signal drop in the peripheral area of the lesion and a heterogeneous signal drop at the center of the lesion; C: T2-weighted image shows the lesion’s center hyperintensity equal to subcutaneous fat. The peripheral area of the lesion shows mild hyperintensity; D: Diffusion-weighted image shows the peripheral area of the lesion and hyperintensity on the diffusion-weighted image. The center of the fat-dominant area shows hypointensity; E: Apparent diffusion coefficient map shows the peripheral area of the lesion hypointensity (white arrow). This indicates that the diffusion in this area is restricted.
- Citation: Sato A, Saito K, Abe K, Sugimoto K, Nagao T, Sukeda A, Yunaiyama D. Indium chloride bone marrow scintigraphy for hepatic myelolipoma: A case report. World J Clin Cases 2023; 11(18): 4377-4383
- URL: https://www.wjgnet.com/2307-8960/full/v11/i18/4377.htm
- DOI: https://dx.doi.org/10.12998/wjcc.v11.i18.4377


