Copyright
©The Author(s) 2023.
World J Clin Cases. Apr 26, 2023; 11(12): 2716-2728
Published online Apr 26, 2023. doi: 10.12998/wjcc.v11.i12.2716
Published online Apr 26, 2023. doi: 10.12998/wjcc.v11.i12.2716
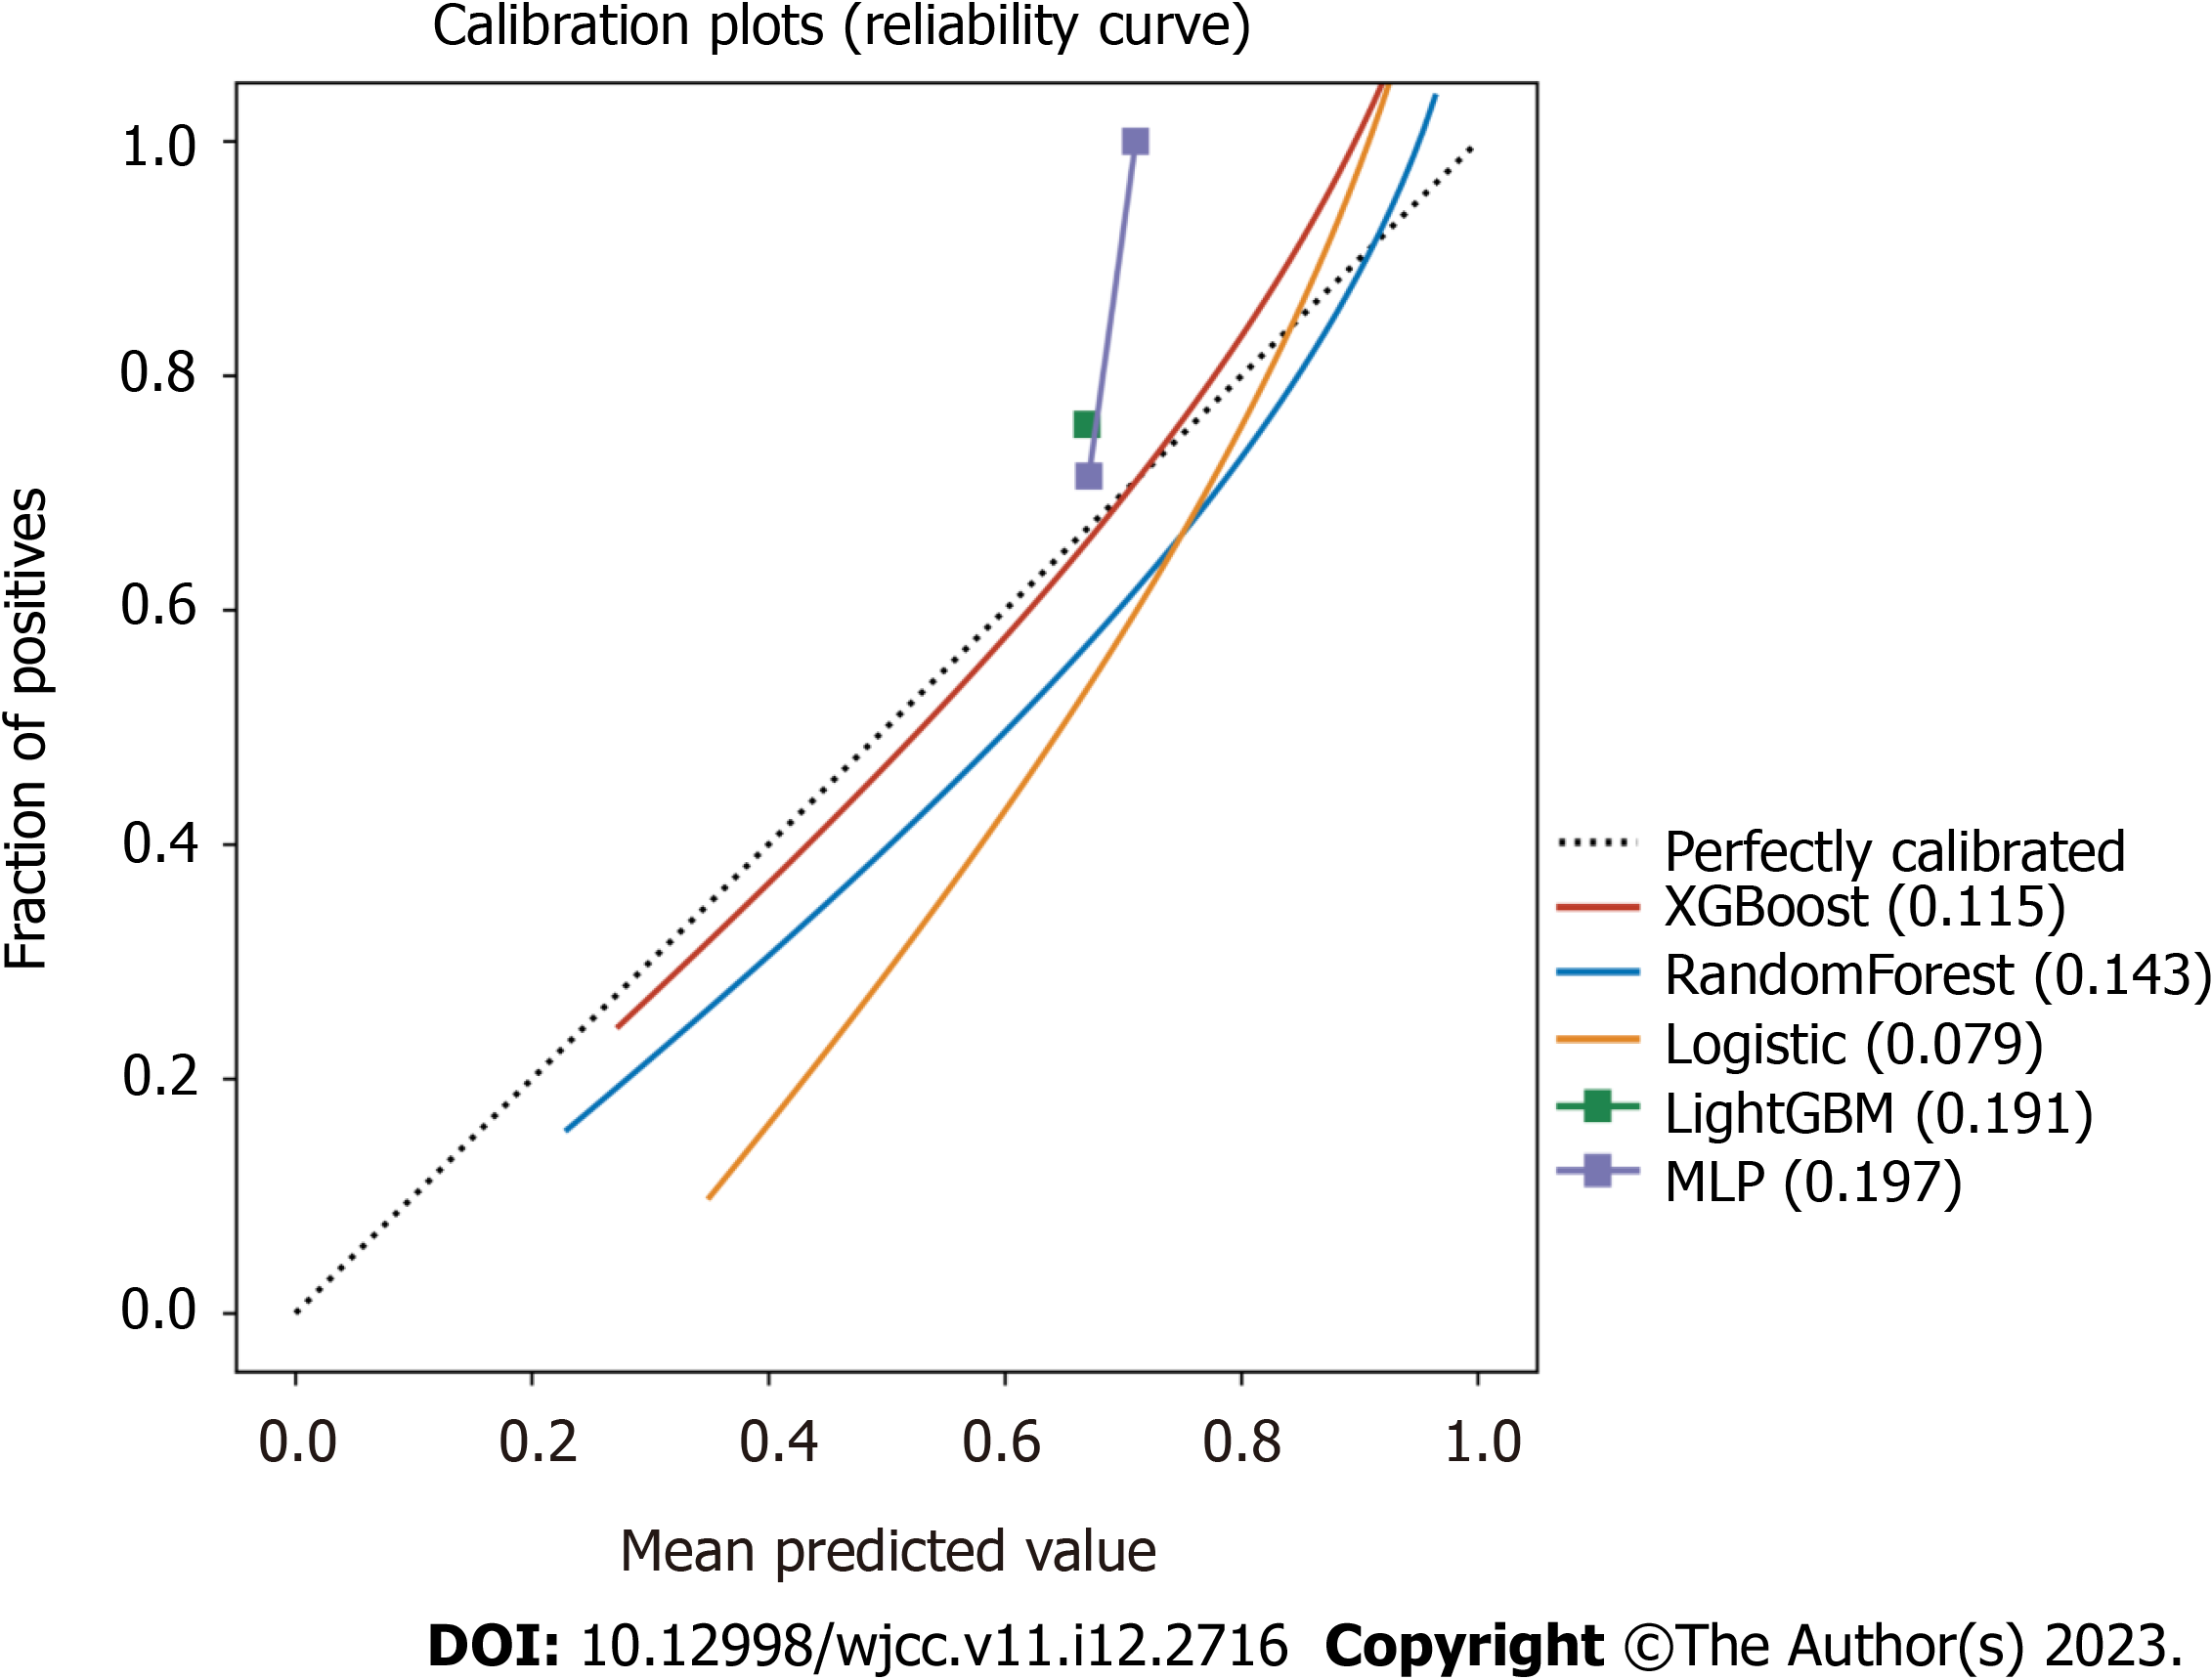
Figure 3 Calibration plot of the different models.
The model-predicted probability was plotted on the x-axis; the actual risks were plotted on the y-axis. An ideal calibration plot is indicated by a 45° diagonal line.
- Citation: Li QY, An ZY, Pan ZH, Wang ZZ, Wang YR, Zhang XG, Shen N. Severe/critical COVID-19 early warning system based on machine learning algorithms using novel imaging scores. World J Clin Cases 2023; 11(12): 2716-2728
- URL: https://www.wjgnet.com/2307-8960/full/v11/i12/2716.htm
- DOI: https://dx.doi.org/10.12998/wjcc.v11.i12.2716


