Copyright
©The Author(s) 2022.
World J Clin Cases. Mar 26, 2022; 10(9): 2908-2915
Published online Mar 26, 2022. doi: 10.12998/wjcc.v10.i9.2908
Published online Mar 26, 2022. doi: 10.12998/wjcc.v10.i9.2908
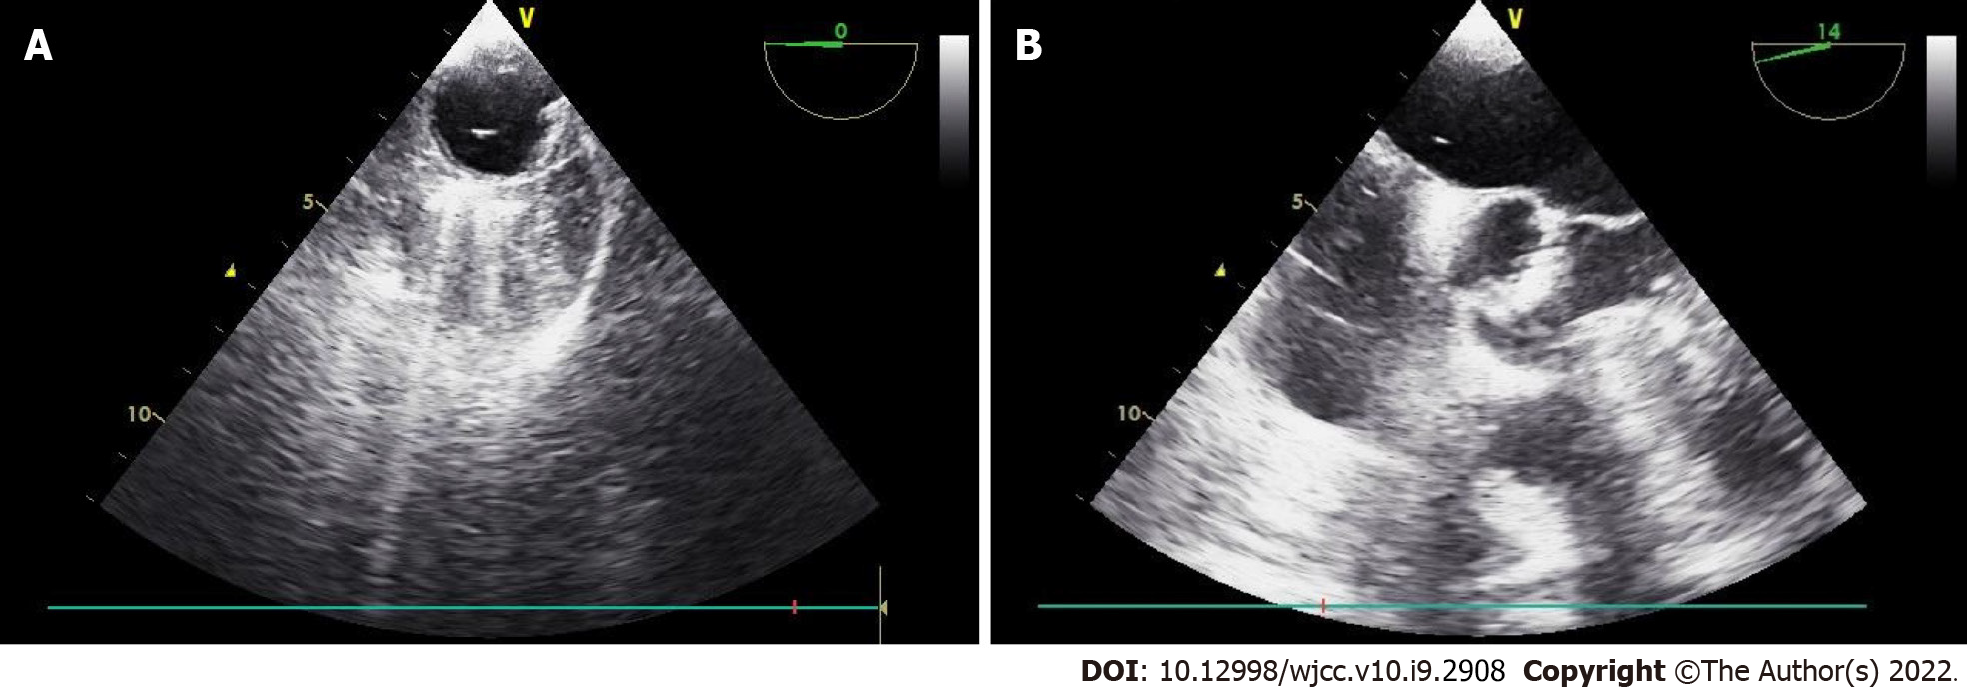
Figure 2 Intraoperative transesophageal echocardiography.
A: On the descending aortic short axis view, transesophageal echocardiography (TEE) shows gas bubbles in the aorta. B: On the mid-esophageal aortic valve short axis view, TEE shows gas bubbles in both the atrium and aortic valve.
- Citation: Jeon S, Hong JM, Lee HJ, Kim Y, Kang H, Hwang BY, Lee D, Jung YH. Paradoxical carbon dioxide embolism during laparoscopic hepatectomy without intracardiac shunt: A case report. World J Clin Cases 2022; 10(9): 2908-2915
- URL: https://www.wjgnet.com/2307-8960/full/v10/i9/2908.htm
- DOI: https://dx.doi.org/10.12998/wjcc.v10.i9.2908


