Copyright
©The Author(s) 2022.
World J Clin Cases. Nov 26, 2022; 10(33): 12077-12088
Published online Nov 26, 2022. doi: 10.12998/wjcc.v10.i33.12077
Published online Nov 26, 2022. doi: 10.12998/wjcc.v10.i33.12077
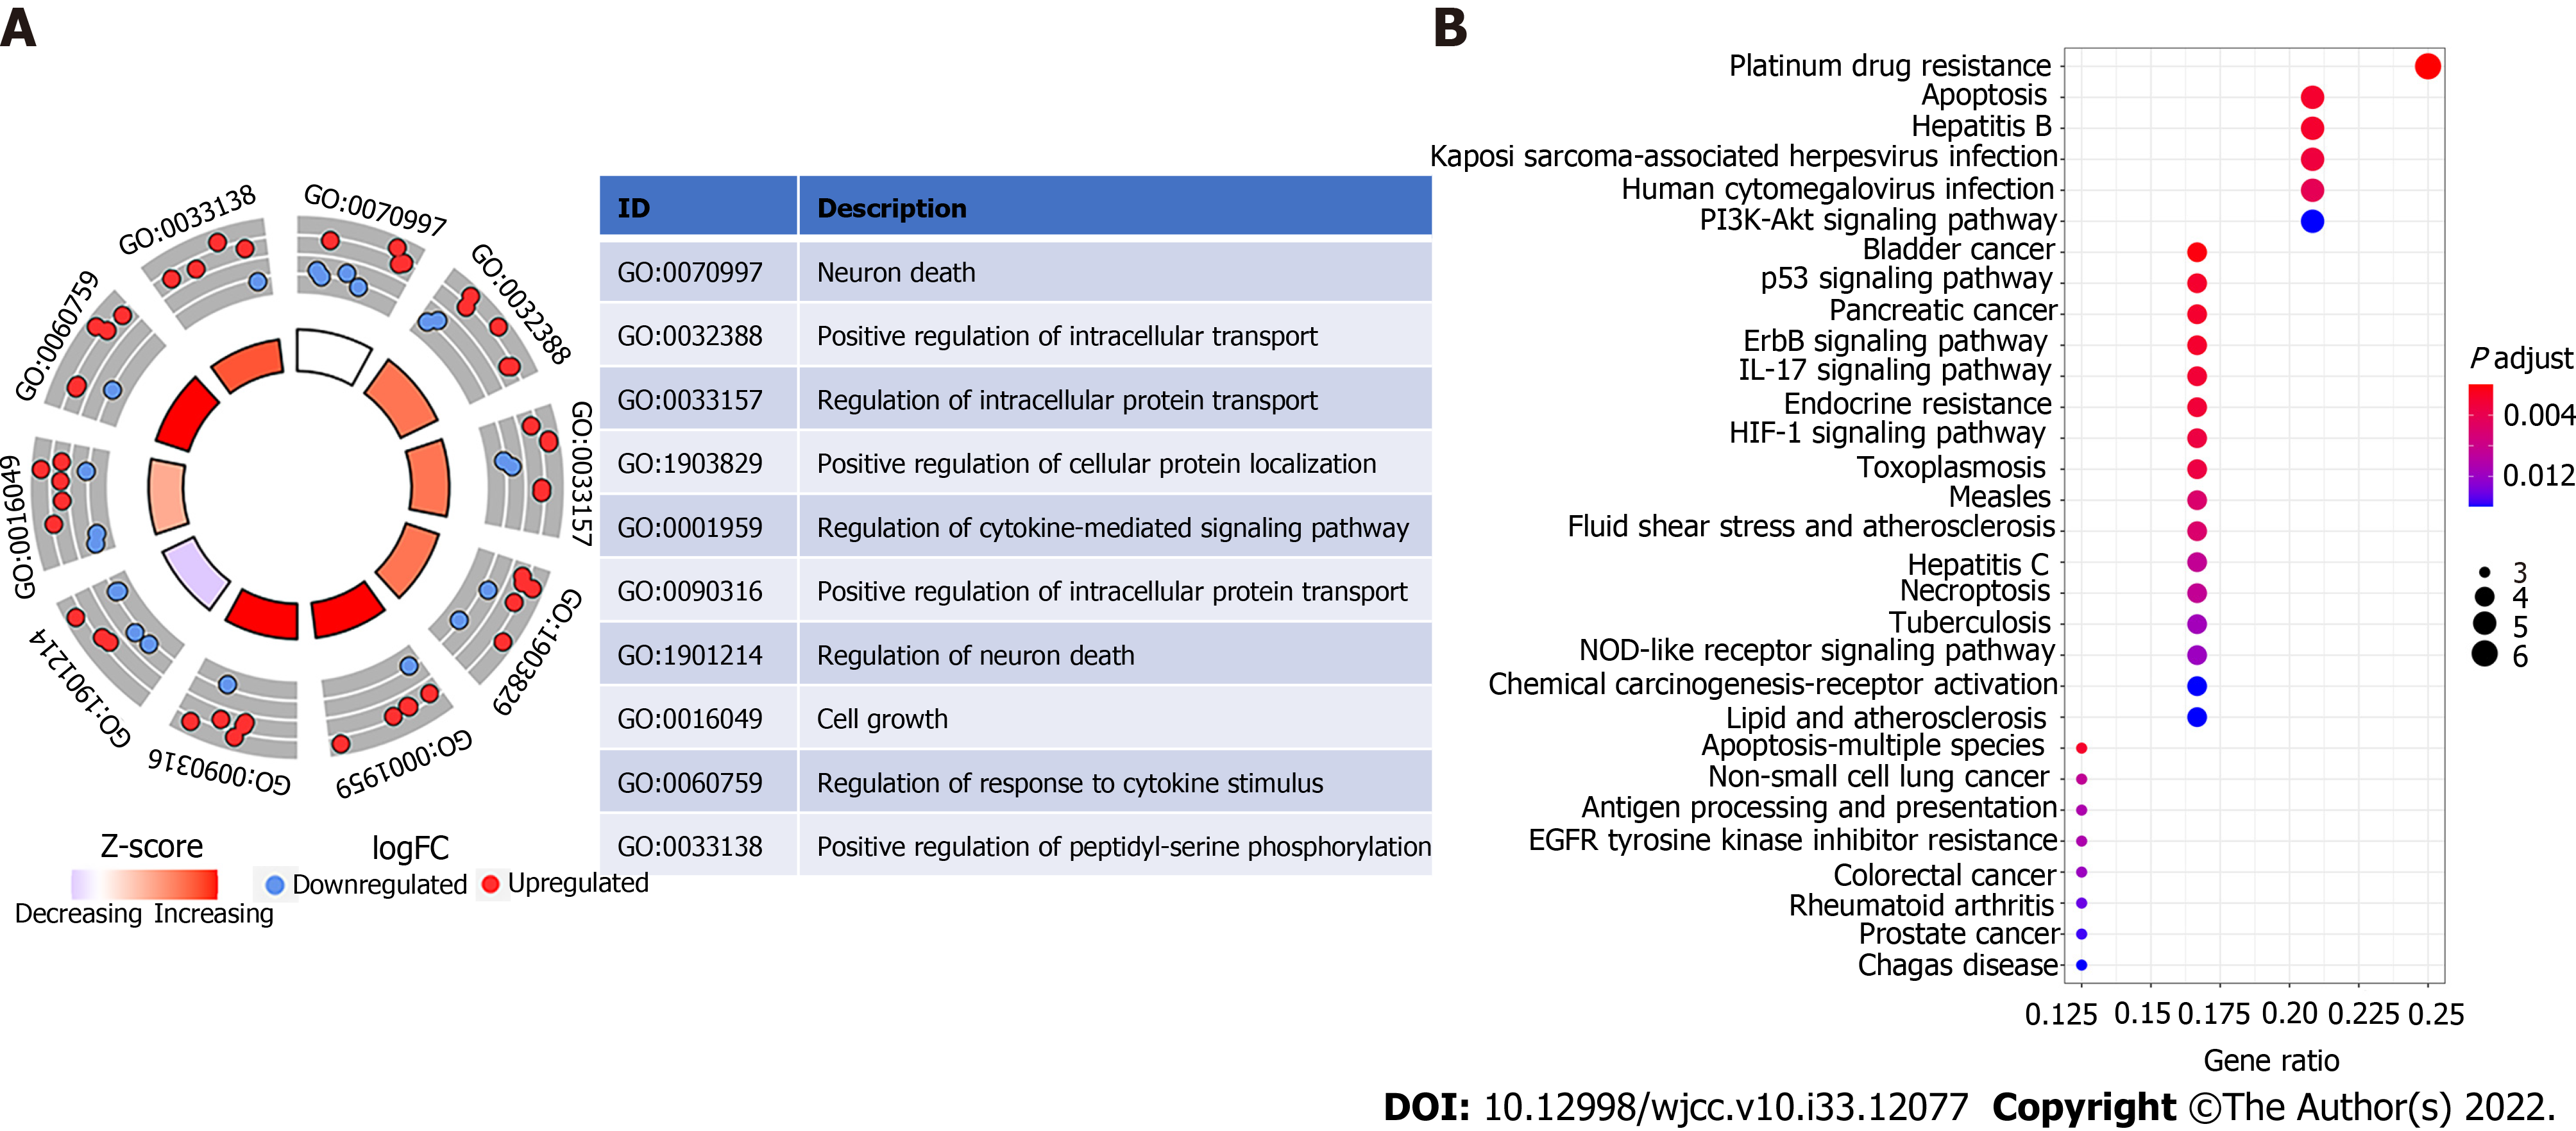
Figure 4 Representative results of Gene Ontology circle plot and Kyoto Encyclopedia of Genes and Genomes analyses.
A: The inner ring is a bar plot where the height of the bar indicates the significance of the term (log10 adjusted P value), and color corresponded to the Z-score. The outer ring displays scatterplots of the expression levels (log fold change) for the genes in each term. The table represents the distribution of platelet-related genes in significant gene ontology terms; B: Most significant or shared Kyoto Encyclopedia of Genes and Genomes pathways. FC: Fold change; GO: Gene ontology.
- Citation: Du QC, Wang XY, Hu CK, Zhou L, Fu Z, Liu S, Wang J, Ma YY, Liu MY, Yu H. Integrative analysis of platelet-related genes for the prognosis of esophageal cancer. World J Clin Cases 2022; 10(33): 12077-12088
- URL: https://www.wjgnet.com/2307-8960/full/v10/i33/12077.htm
- DOI: https://dx.doi.org/10.12998/wjcc.v10.i33.12077


