Copyright
©The Author(s) 2022.
World J Clin Cases. Nov 16, 2022; 10(32): 11726-11742
Published online Nov 16, 2022. doi: 10.12998/wjcc.v10.i32.11726
Published online Nov 16, 2022. doi: 10.12998/wjcc.v10.i32.11726
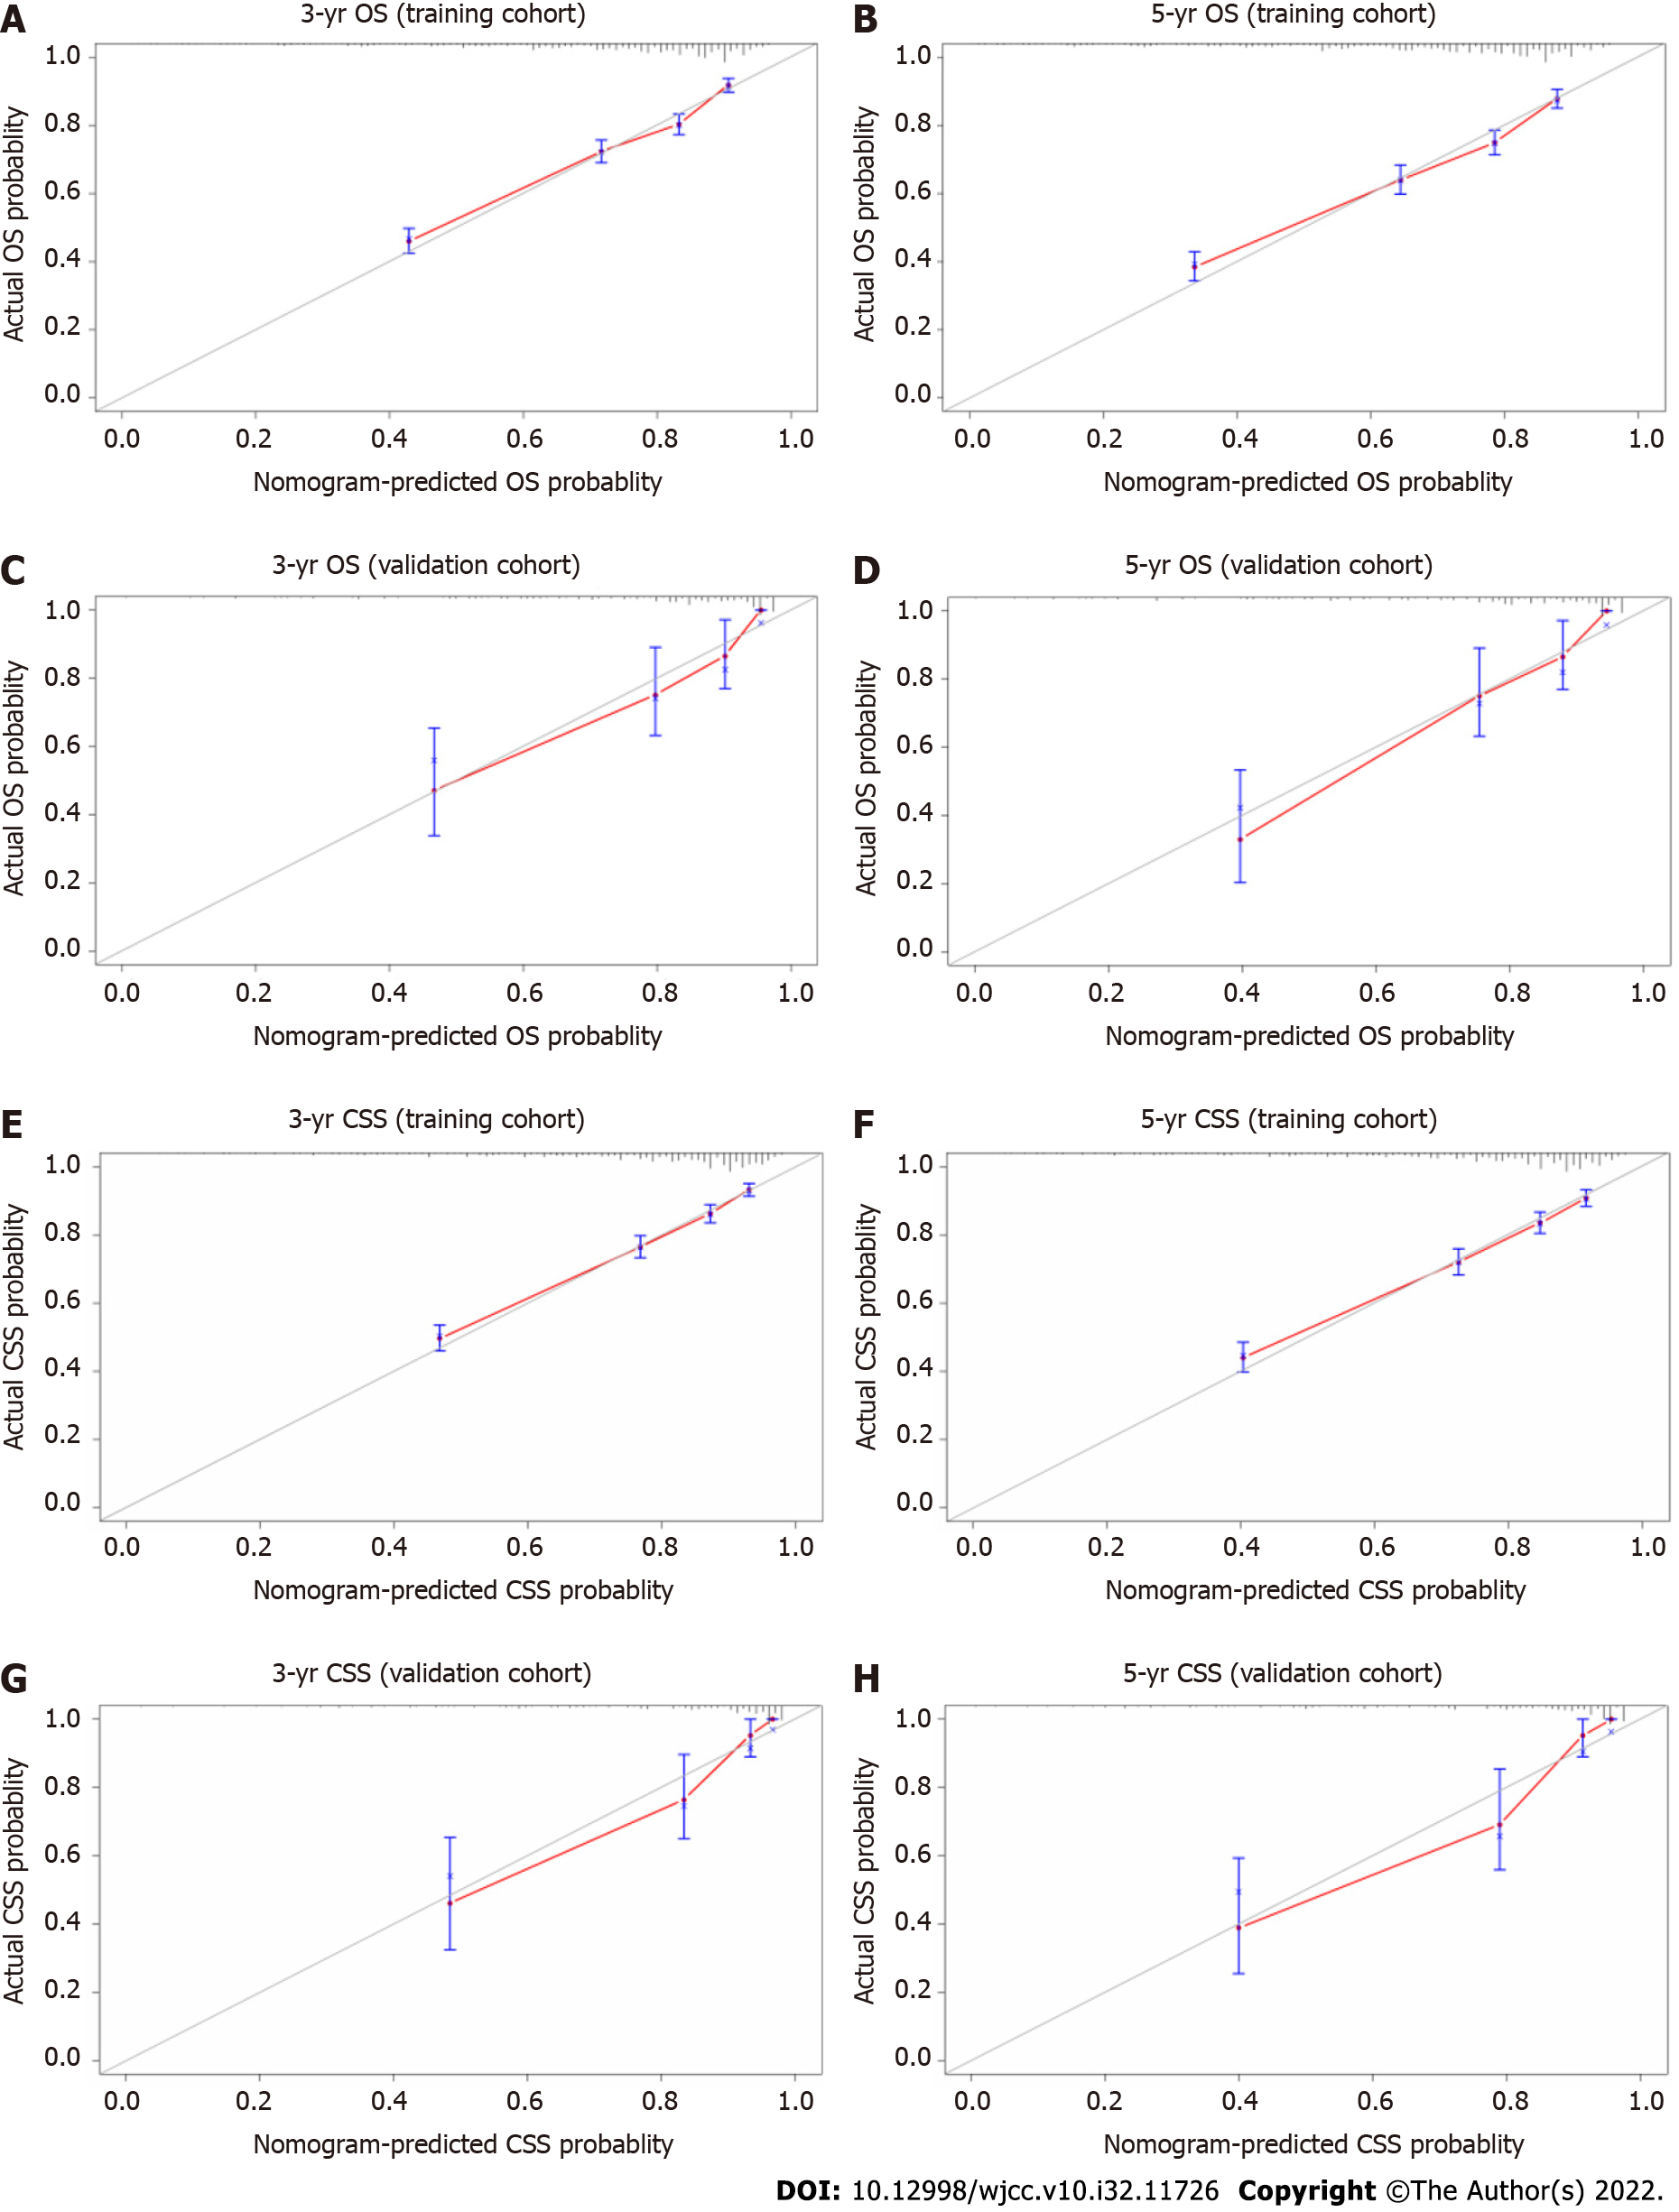
Figure 3 Calibration curves for 3- and 5-year overall survival and 3- and 5-year cancer-specific survival in patients with squamous cell carcinoma of the tongue.
A: Calibration curves for 3-year overall survival (OS) in the training cohort; B: Calibration curves for 5-year OS in the training cohort; C: Calibration curves for 3-year OS in the validation cohort; D: Calibration curves for 5-year OS in the validation cohort; E: Calibration curves for 3-year cancer-specific survival (CSS) in the training cohort; F: Calibration curves for 5-year CSS in the training cohort; G: Calibration curves for 3-year CSS in the validation cohort; H: Calibration curves for 5-year CSS in the validation cohort. The gray line indicates perfect prediction. Blue lines indicate 95% confidence intervals (CIs). The red line indicates nomogram performance. Red and gray lines close together indicates greater nomogram accuracy.
- Citation: Luo XY, Zhang YM, Zhu RQ, Yang SS, Zhou LF, Zhu HY. Development and validation of novel nomograms to predict survival of patients with tongue squamous cell carcinoma. World J Clin Cases 2022; 10(32): 11726-11742
- URL: https://www.wjgnet.com/2307-8960/full/v10/i32/11726.htm
- DOI: https://dx.doi.org/10.12998/wjcc.v10.i32.11726


