
















©The Author(s) 2022.
World J Clin Cases. Nov 6, 2022; 10(31): 11338-11348
Published online Nov 6, 2022. doi: 10.12998/wjcc.v10.i31.11338
Published online Nov 6, 2022. doi: 10.12998/wjcc.v10.i31.11338
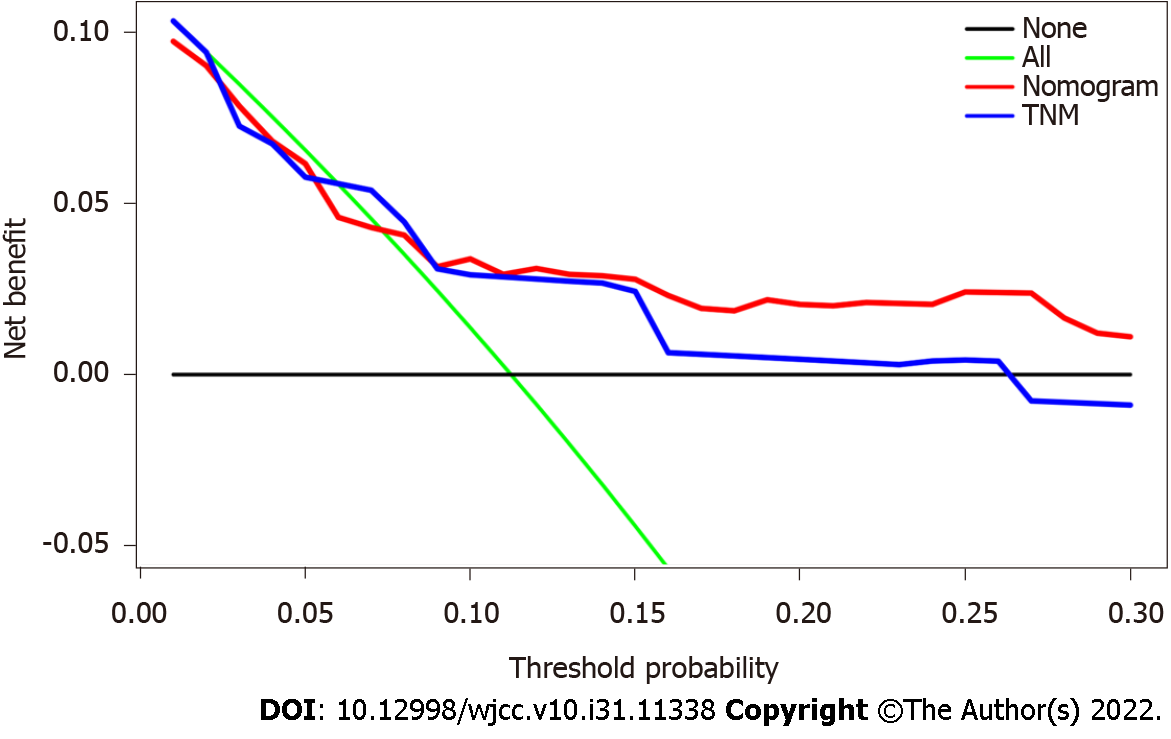
Figure 4 Analysis of the decision curve showing the performance comparison.
On the black line, it is assumed that no patient should take the necessary measures, and on the green line, it is assumed that all patients should. By adding benefits points and subtracting harm points, the y axis represents the net benefit. Our results indicated that the nomogram (red line) provided a higher net benefit than the tumor, node and metastasis staging model (blue line), based on threshold probabilities. TNM: Tumor, node, metastasis.
- Citation: Lin WX, Xie YN, Chen YK, Cai JH, Zou J, Zheng JH, Liu YY, Li ZY, Chen YX. Nomogram for predicting overall survival in Chinese triple-negative breast cancer patients after surgery. World J Clin Cases 2022; 10(31): 11338-11348
- URL: https://www.wjgnet.com/2307-8960/full/v10/i31/11338.htm
- DOI: https://dx.doi.org/10.12998/wjcc.v10.i31.11338