Copyright
©The Author(s) 2022.
World J Clin Cases. Aug 26, 2022; 10(24): 8718-8727
Published online Aug 26, 2022. doi: 10.12998/wjcc.v10.i24.8718
Published online Aug 26, 2022. doi: 10.12998/wjcc.v10.i24.8718
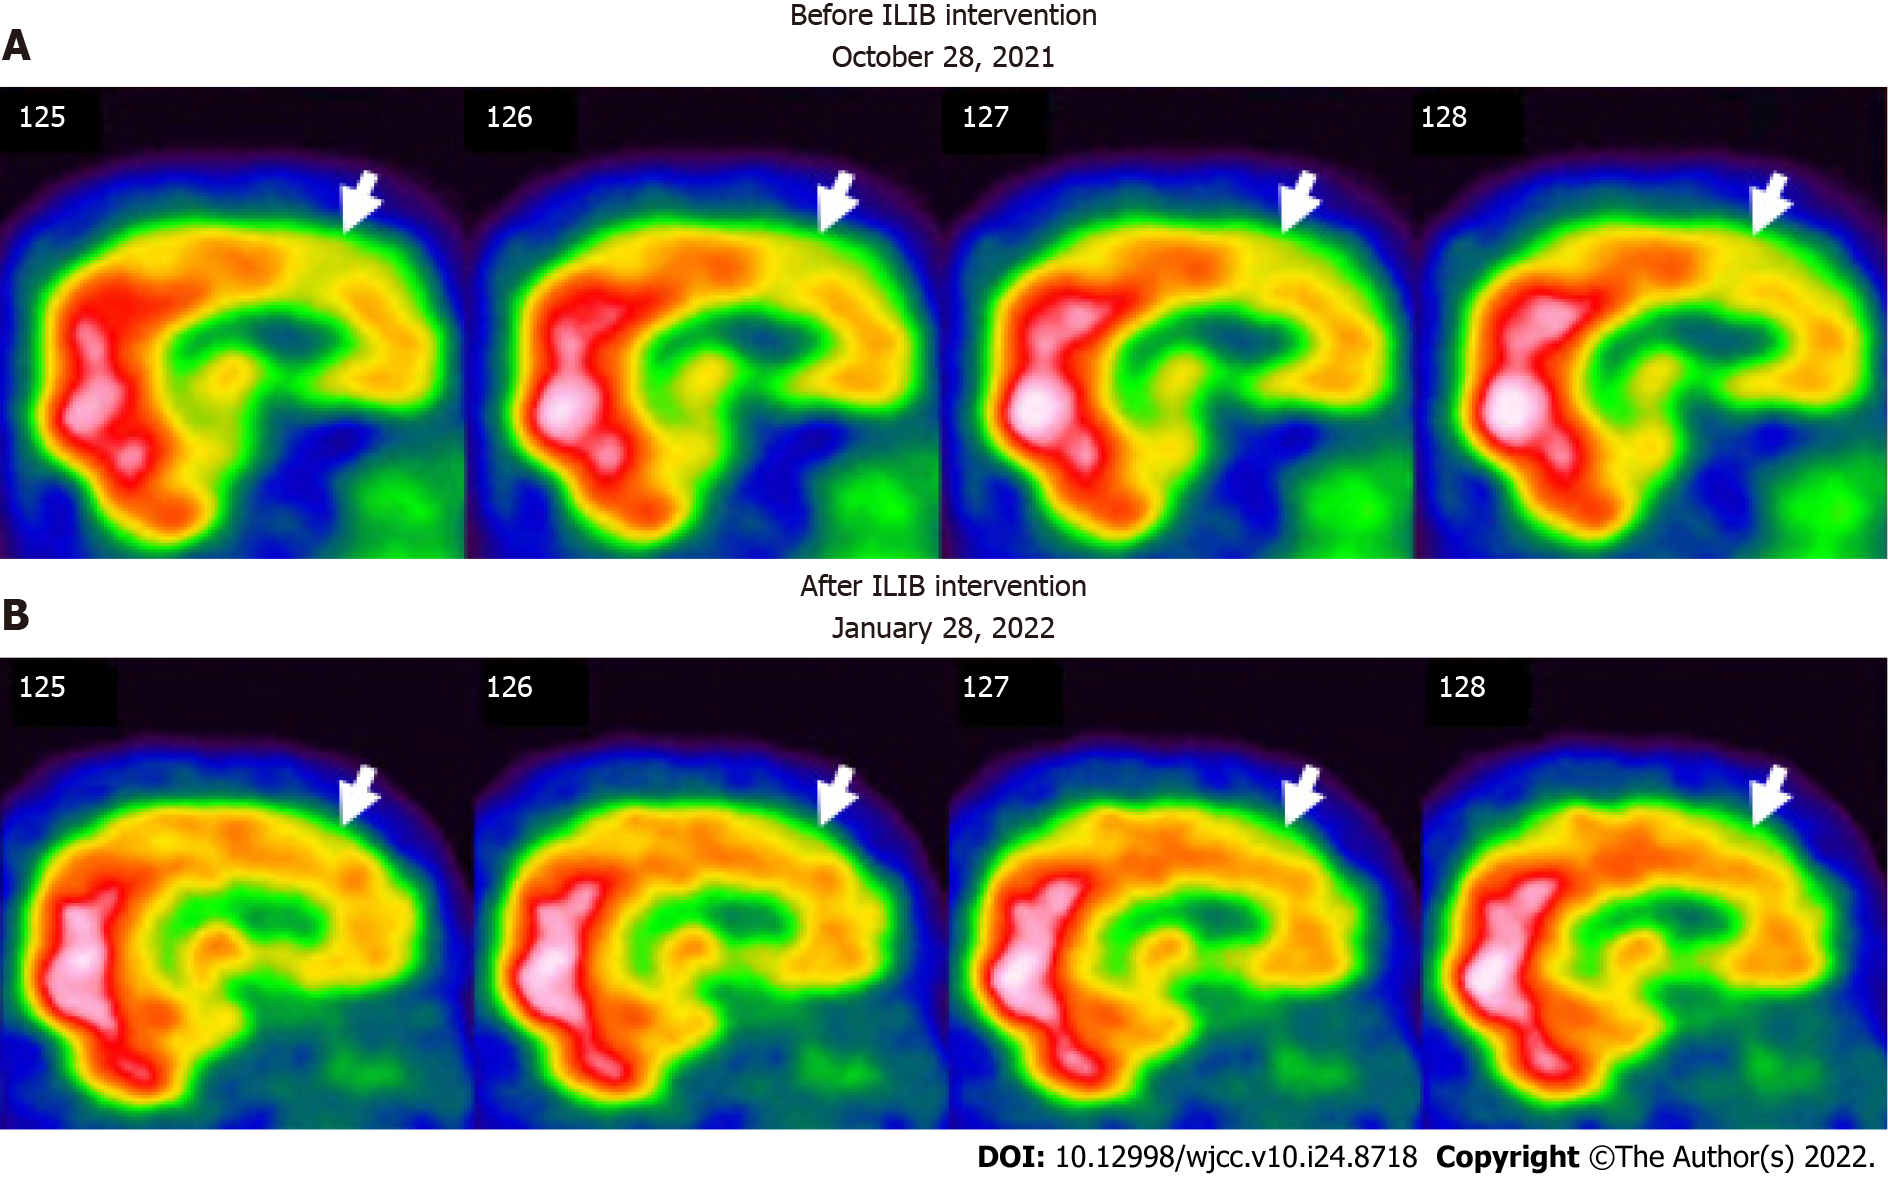
Figure 3 Regional perfusion brain single-photon emission computed tomography before and after therapeutic intravascular laser irradiation of blood intervention (sagittal view).
The white to red and green to blue areas indicate high and low perfusion, respectively. A:The first single-photon emission computed tomography (SPECT) (before ILIB intervention) shows perfusion deficits in the frontal lobe (white arrows); B: The second SPECT [after the third course of intravascular laser irradiation of blood (ILIB) intervention] shows more blood flow in the frontal lobe (white arrows). ILIB: Intravascular laser irradiation of blood.
- Citation: Lan CH, Wu YC, Chiang CC, Chang ST. Effects of intravascular photobiomodulation on motor deficits and brain perfusion images in intractable myasthenia gravis: A case report. World J Clin Cases 2022; 10(24): 8718-8727
- URL: https://www.wjgnet.com/2307-8960/full/v10/i24/8718.htm
- DOI: https://dx.doi.org/10.12998/wjcc.v10.i24.8718


