Copyright
©The Author(s) 2022.
World J Clin Cases. Aug 26, 2022; 10(24): 8490-8505
Published online Aug 26, 2022. doi: 10.12998/wjcc.v10.i24.8490
Published online Aug 26, 2022. doi: 10.12998/wjcc.v10.i24.8490
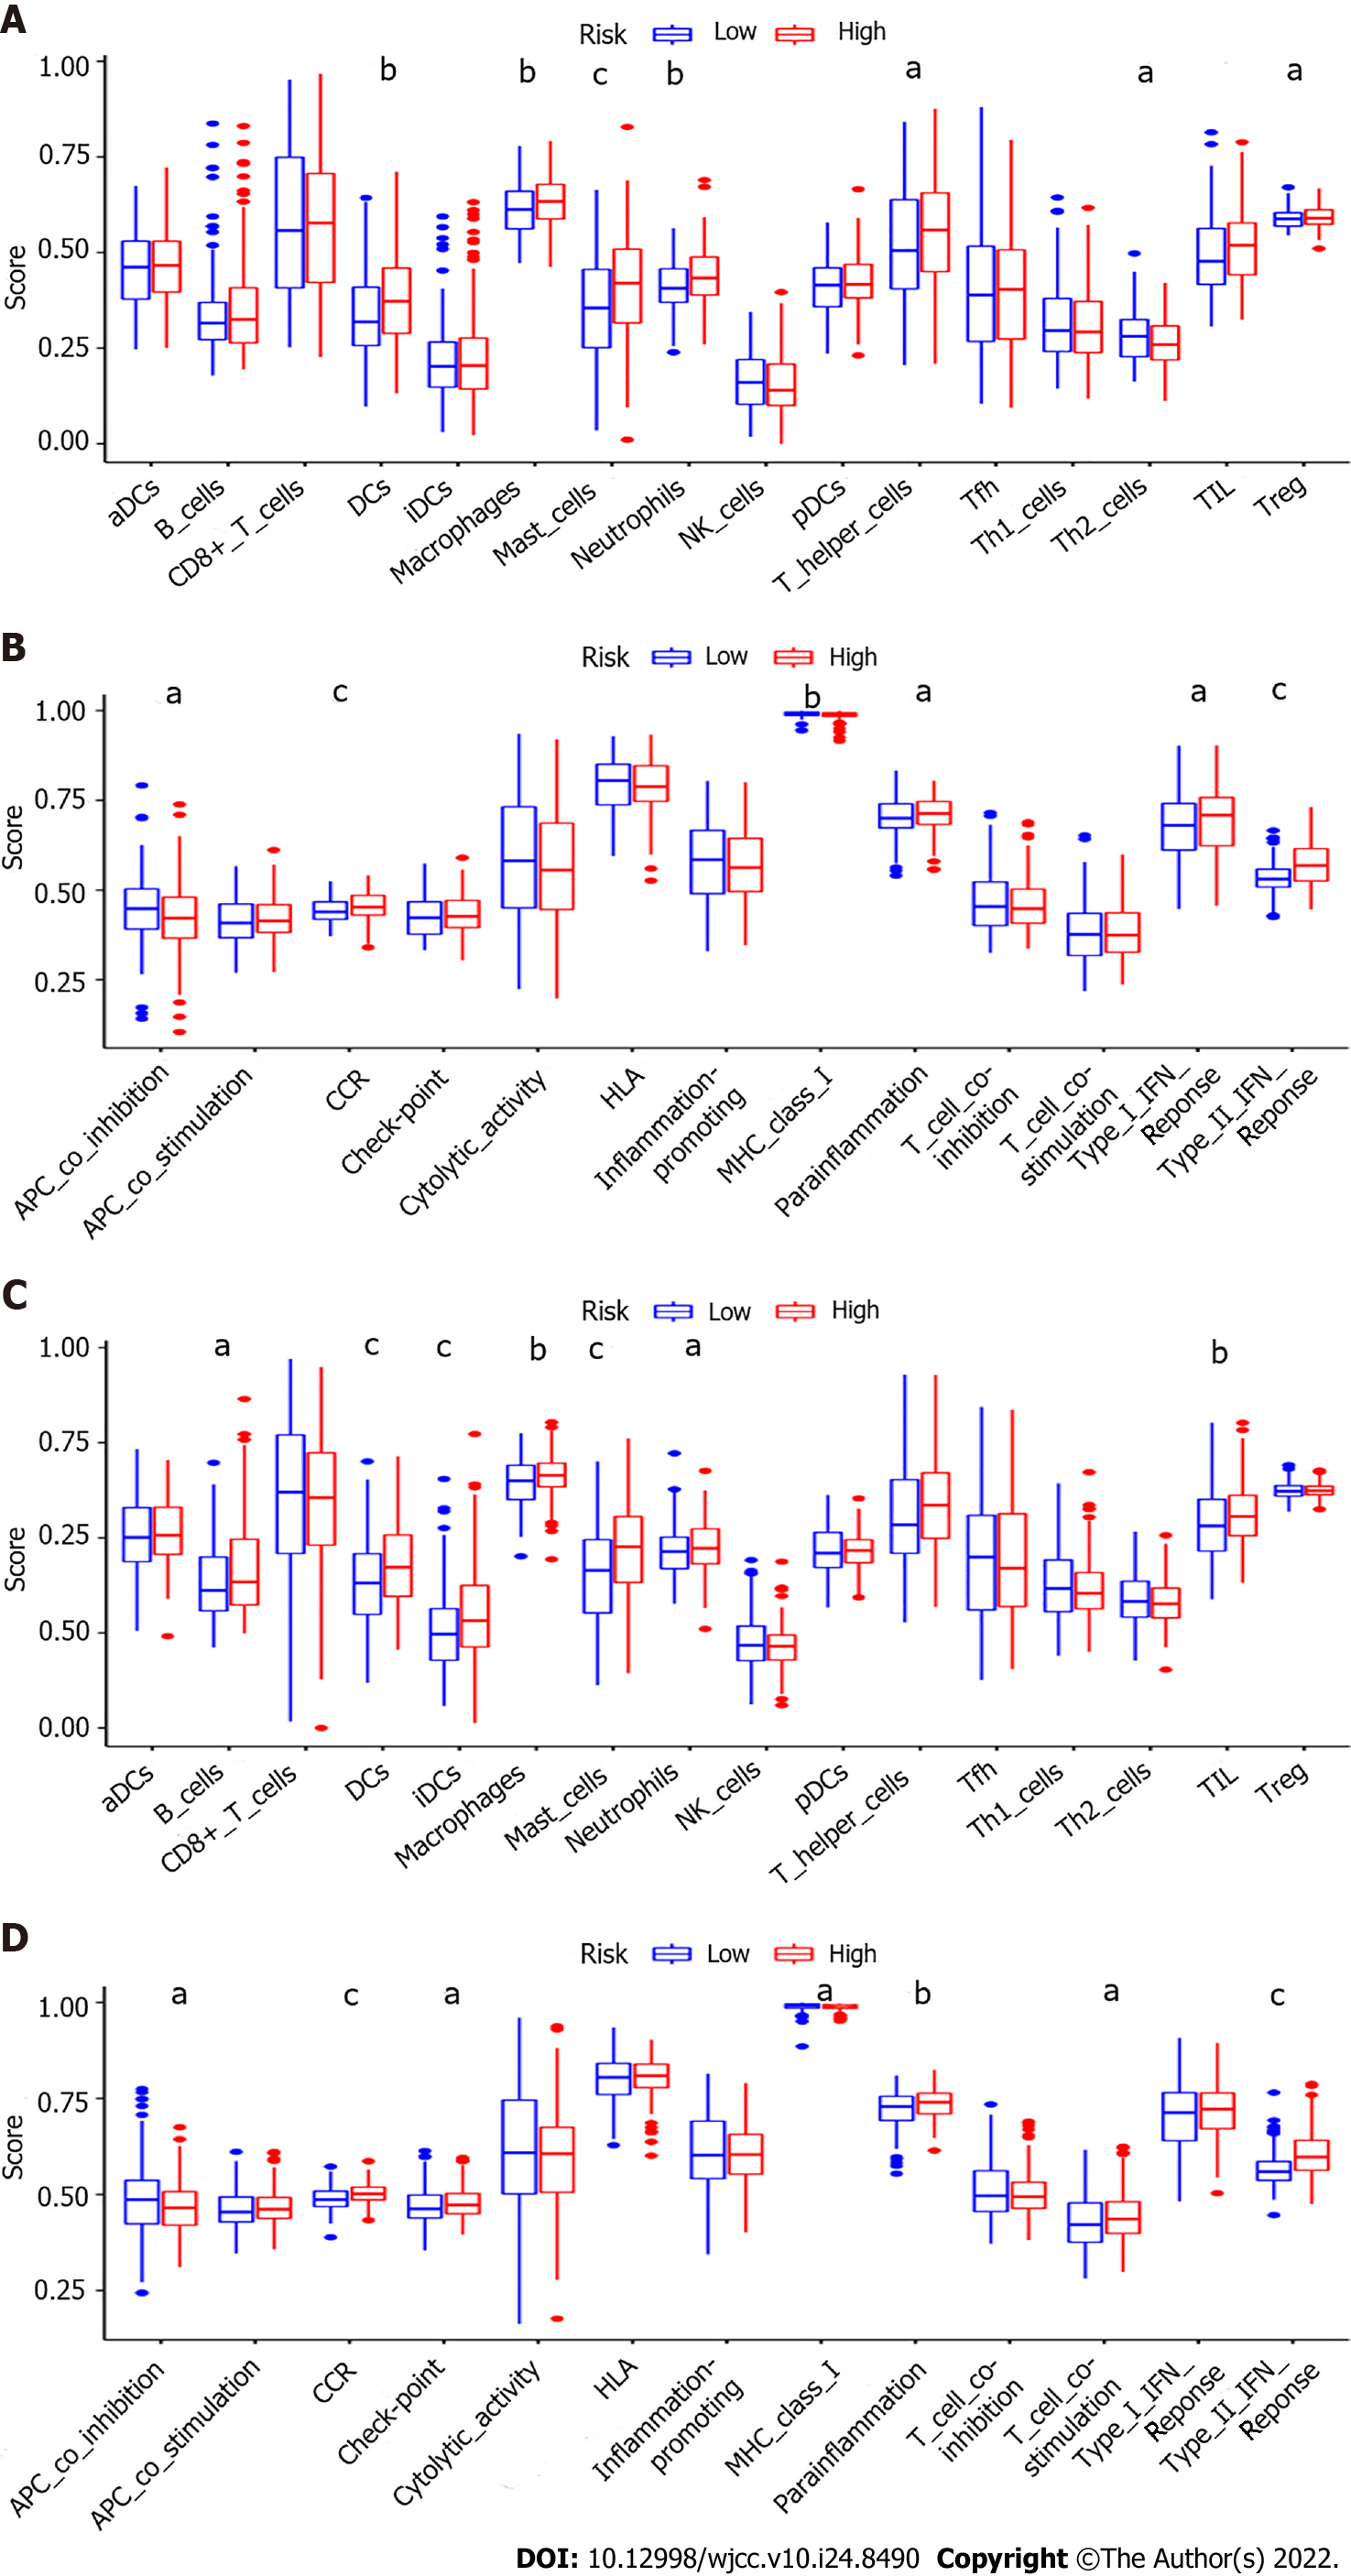
Figure 8 Comparison of the single sample gene set enrichment analysis scores for immune cells and immune pathways.
A and B: Comparison of the enrichment scores of 16 types of immune cells and 13 immune-related pathways between different risk groups in The Cancer Genome Atlas (TCGA) cohort; C and D: Comparison of the immune infiltration between different risk groups in the Gene Expression Omnibus (GEO) cohort. P values were showed as: aP < 0.05, bP < 0.01, and cP < 0.001.
- Citation: Guan SH, Wang XY, Shang P, Du QC, Li MZ, Xing X, Yan B. Pyroptosis-related genes play a significant role in the prognosis of gastric cancer. World J Clin Cases 2022; 10(24): 8490-8505
- URL: https://www.wjgnet.com/2307-8960/full/v10/i24/8490.htm
- DOI: https://dx.doi.org/10.12998/wjcc.v10.i24.8490


