Copyright
©The Author(s) 2022.
World J Clin Cases. Aug 26, 2022; 10(24): 8490-8505
Published online Aug 26, 2022. doi: 10.12998/wjcc.v10.i24.8490
Published online Aug 26, 2022. doi: 10.12998/wjcc.v10.i24.8490
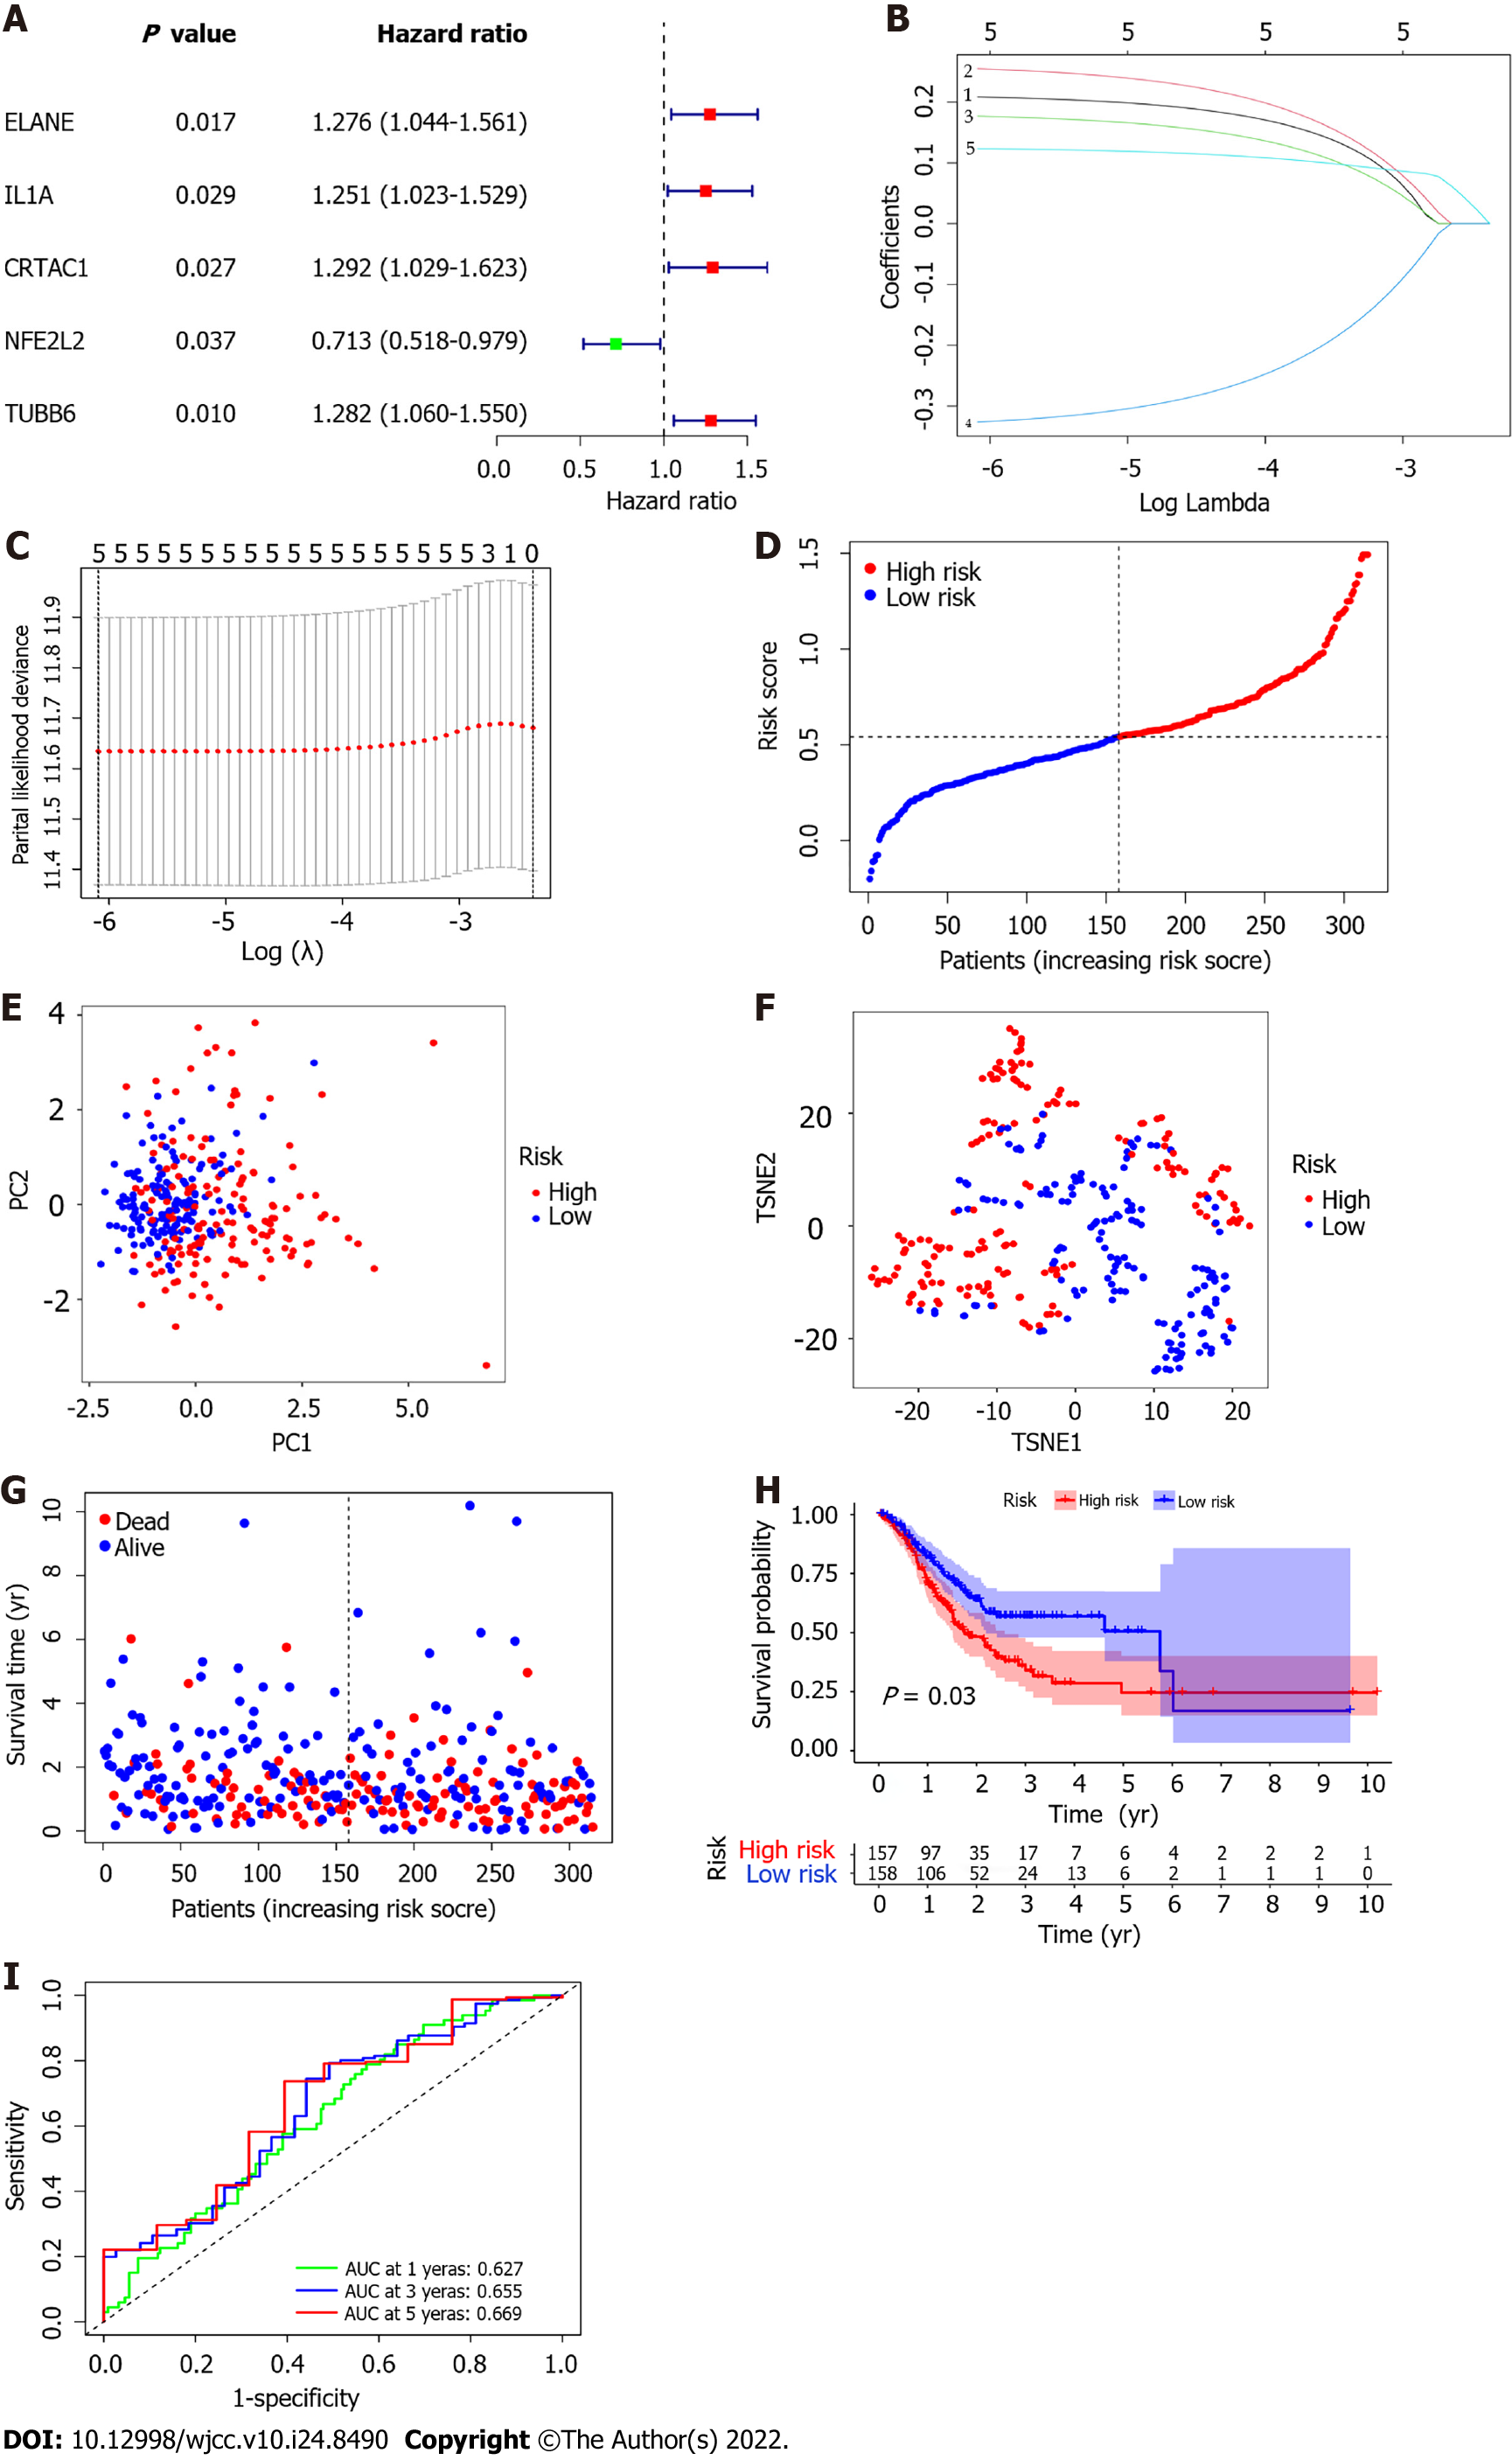
Figure 4 Construction of risk signature in The Cancer Genome Atlas cohort.
A: Univariate Cox regression analysis of overall survival (OS) for each pyroptosis-related genes, and 23 genes with P < 0.001; B and C: The results of the least absolute contraction and selection operator (LASSO) Cox regression indicated that there were 11 OS-related genes; D: Distribution of patients based on the median value of risk score; E and F: Principal component analysis (PCA) plot and t-distributed stochastic neighbor embedding (t-SNE) analysis founded on the risk score; G: The distributions of OS status, OS and risk score for each patient; H: Kaplan-Meier curves for the OS of patients in the high-risk and low-risk groups; I: Area under the curve (AUC) of time-dependent receiver operating characteristic (ROC) curves demonstrated the sensitivity and specificity of the risk score.
- Citation: Guan SH, Wang XY, Shang P, Du QC, Li MZ, Xing X, Yan B. Pyroptosis-related genes play a significant role in the prognosis of gastric cancer. World J Clin Cases 2022; 10(24): 8490-8505
- URL: https://www.wjgnet.com/2307-8960/full/v10/i24/8490.htm
- DOI: https://dx.doi.org/10.12998/wjcc.v10.i24.8490


