Copyright
©The Author(s) 2022.
World J Clin Cases. Jul 6, 2022; 10(19): 6563-6570
Published online Jul 6, 2022. doi: 10.12998/wjcc.v10.i19.6563
Published online Jul 6, 2022. doi: 10.12998/wjcc.v10.i19.6563
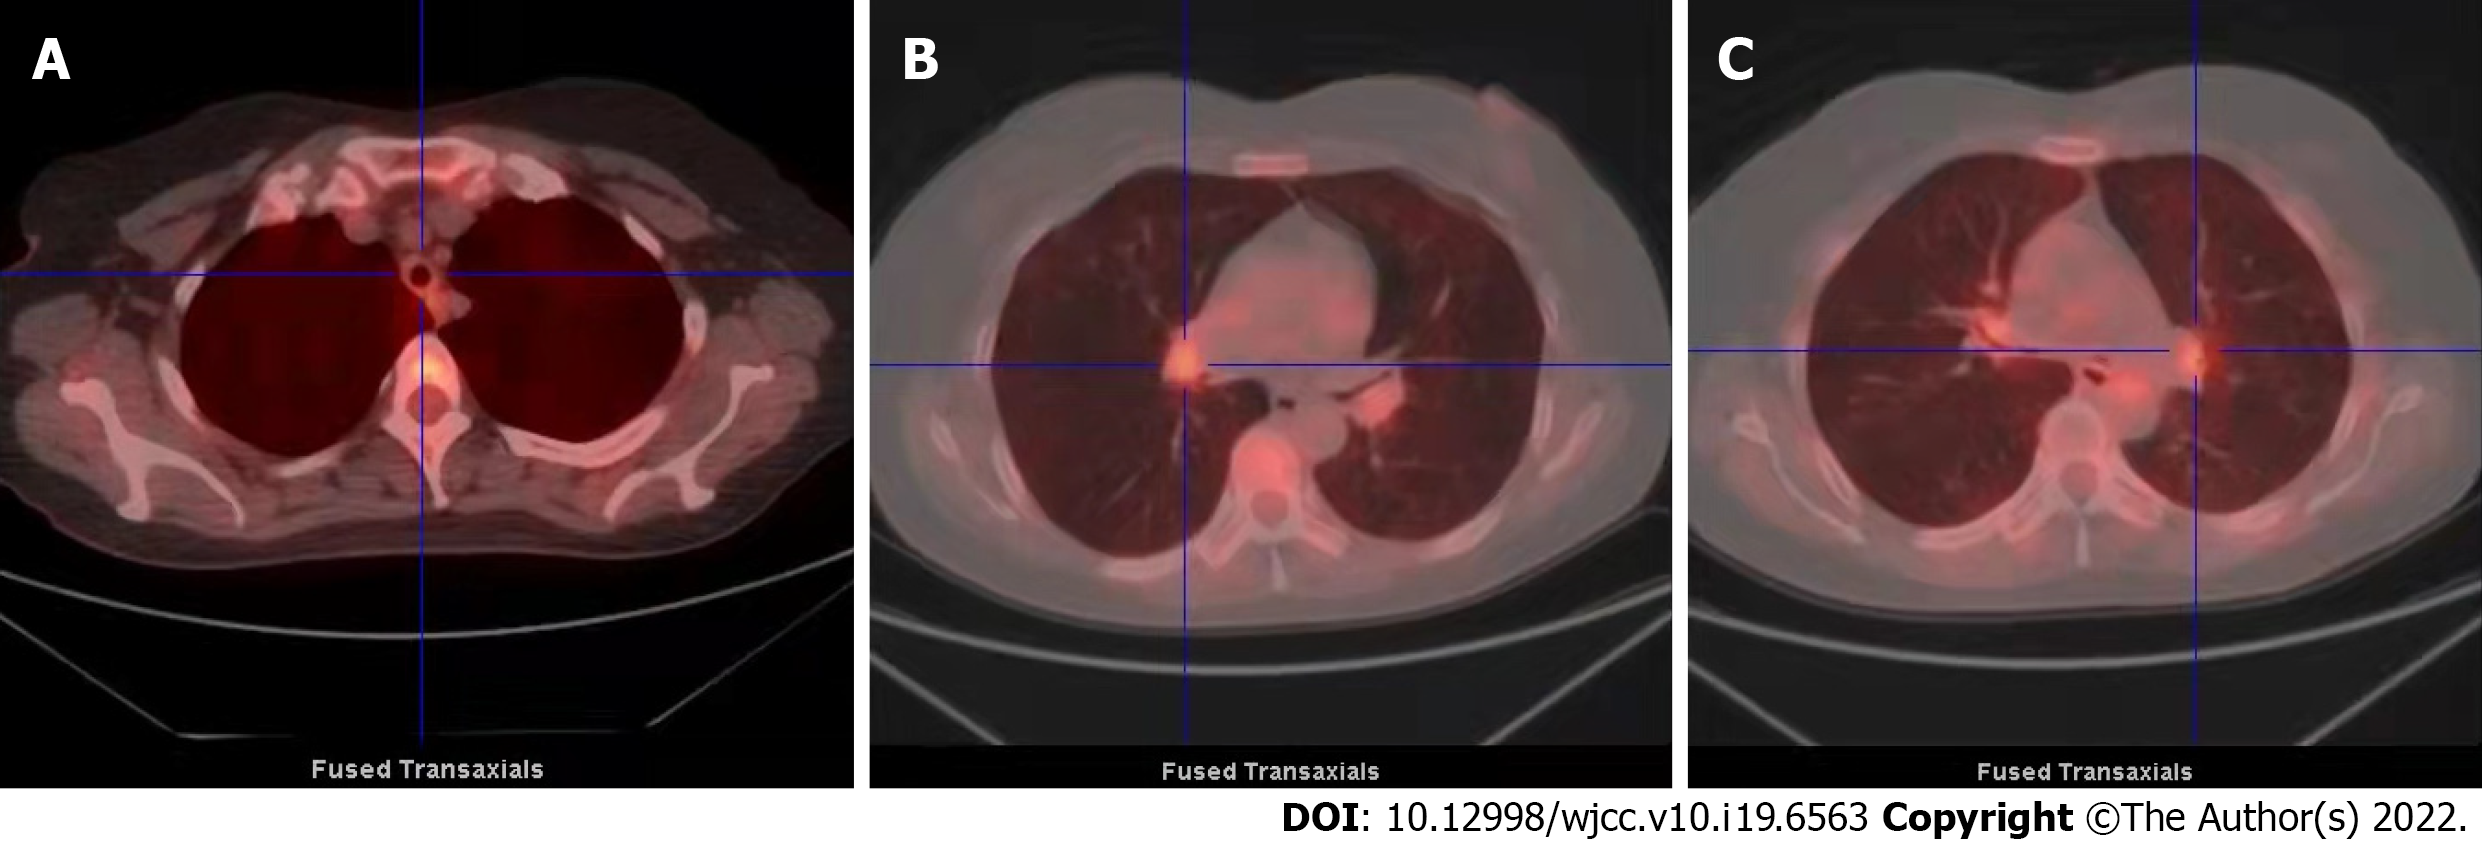
Figure 5 Fluorodeoxyglucose positron emission tomography/computed tomography imaging.
A-C: The walls of the trachea and left and right main bronchi show even thickening (with obvious thickening of the tracheal cartilage). Metabolic activities in these structures are slightly to moderately enhanced, especially near the hilum. The metabolic distributions were figure-eight- or strip-shaped. SUVmax = 2.91.
- Citation: Chen JY, Li XY, Zong C. Relapsing polychondritis with isolated tracheobronchial involvement complicated with Sjogren's syndrome: A case report. World J Clin Cases 2022; 10(19): 6563-6570
- URL: https://www.wjgnet.com/2307-8960/full/v10/i19/6563.htm
- DOI: https://dx.doi.org/10.12998/wjcc.v10.i19.6563


