Copyright
©The Author(s) 2022.
World J Clin Cases. Jun 26, 2022; 10(18): 5965-5983
Published online Jun 26, 2022. doi: 10.12998/wjcc.v10.i18.5965
Published online Jun 26, 2022. doi: 10.12998/wjcc.v10.i18.5965
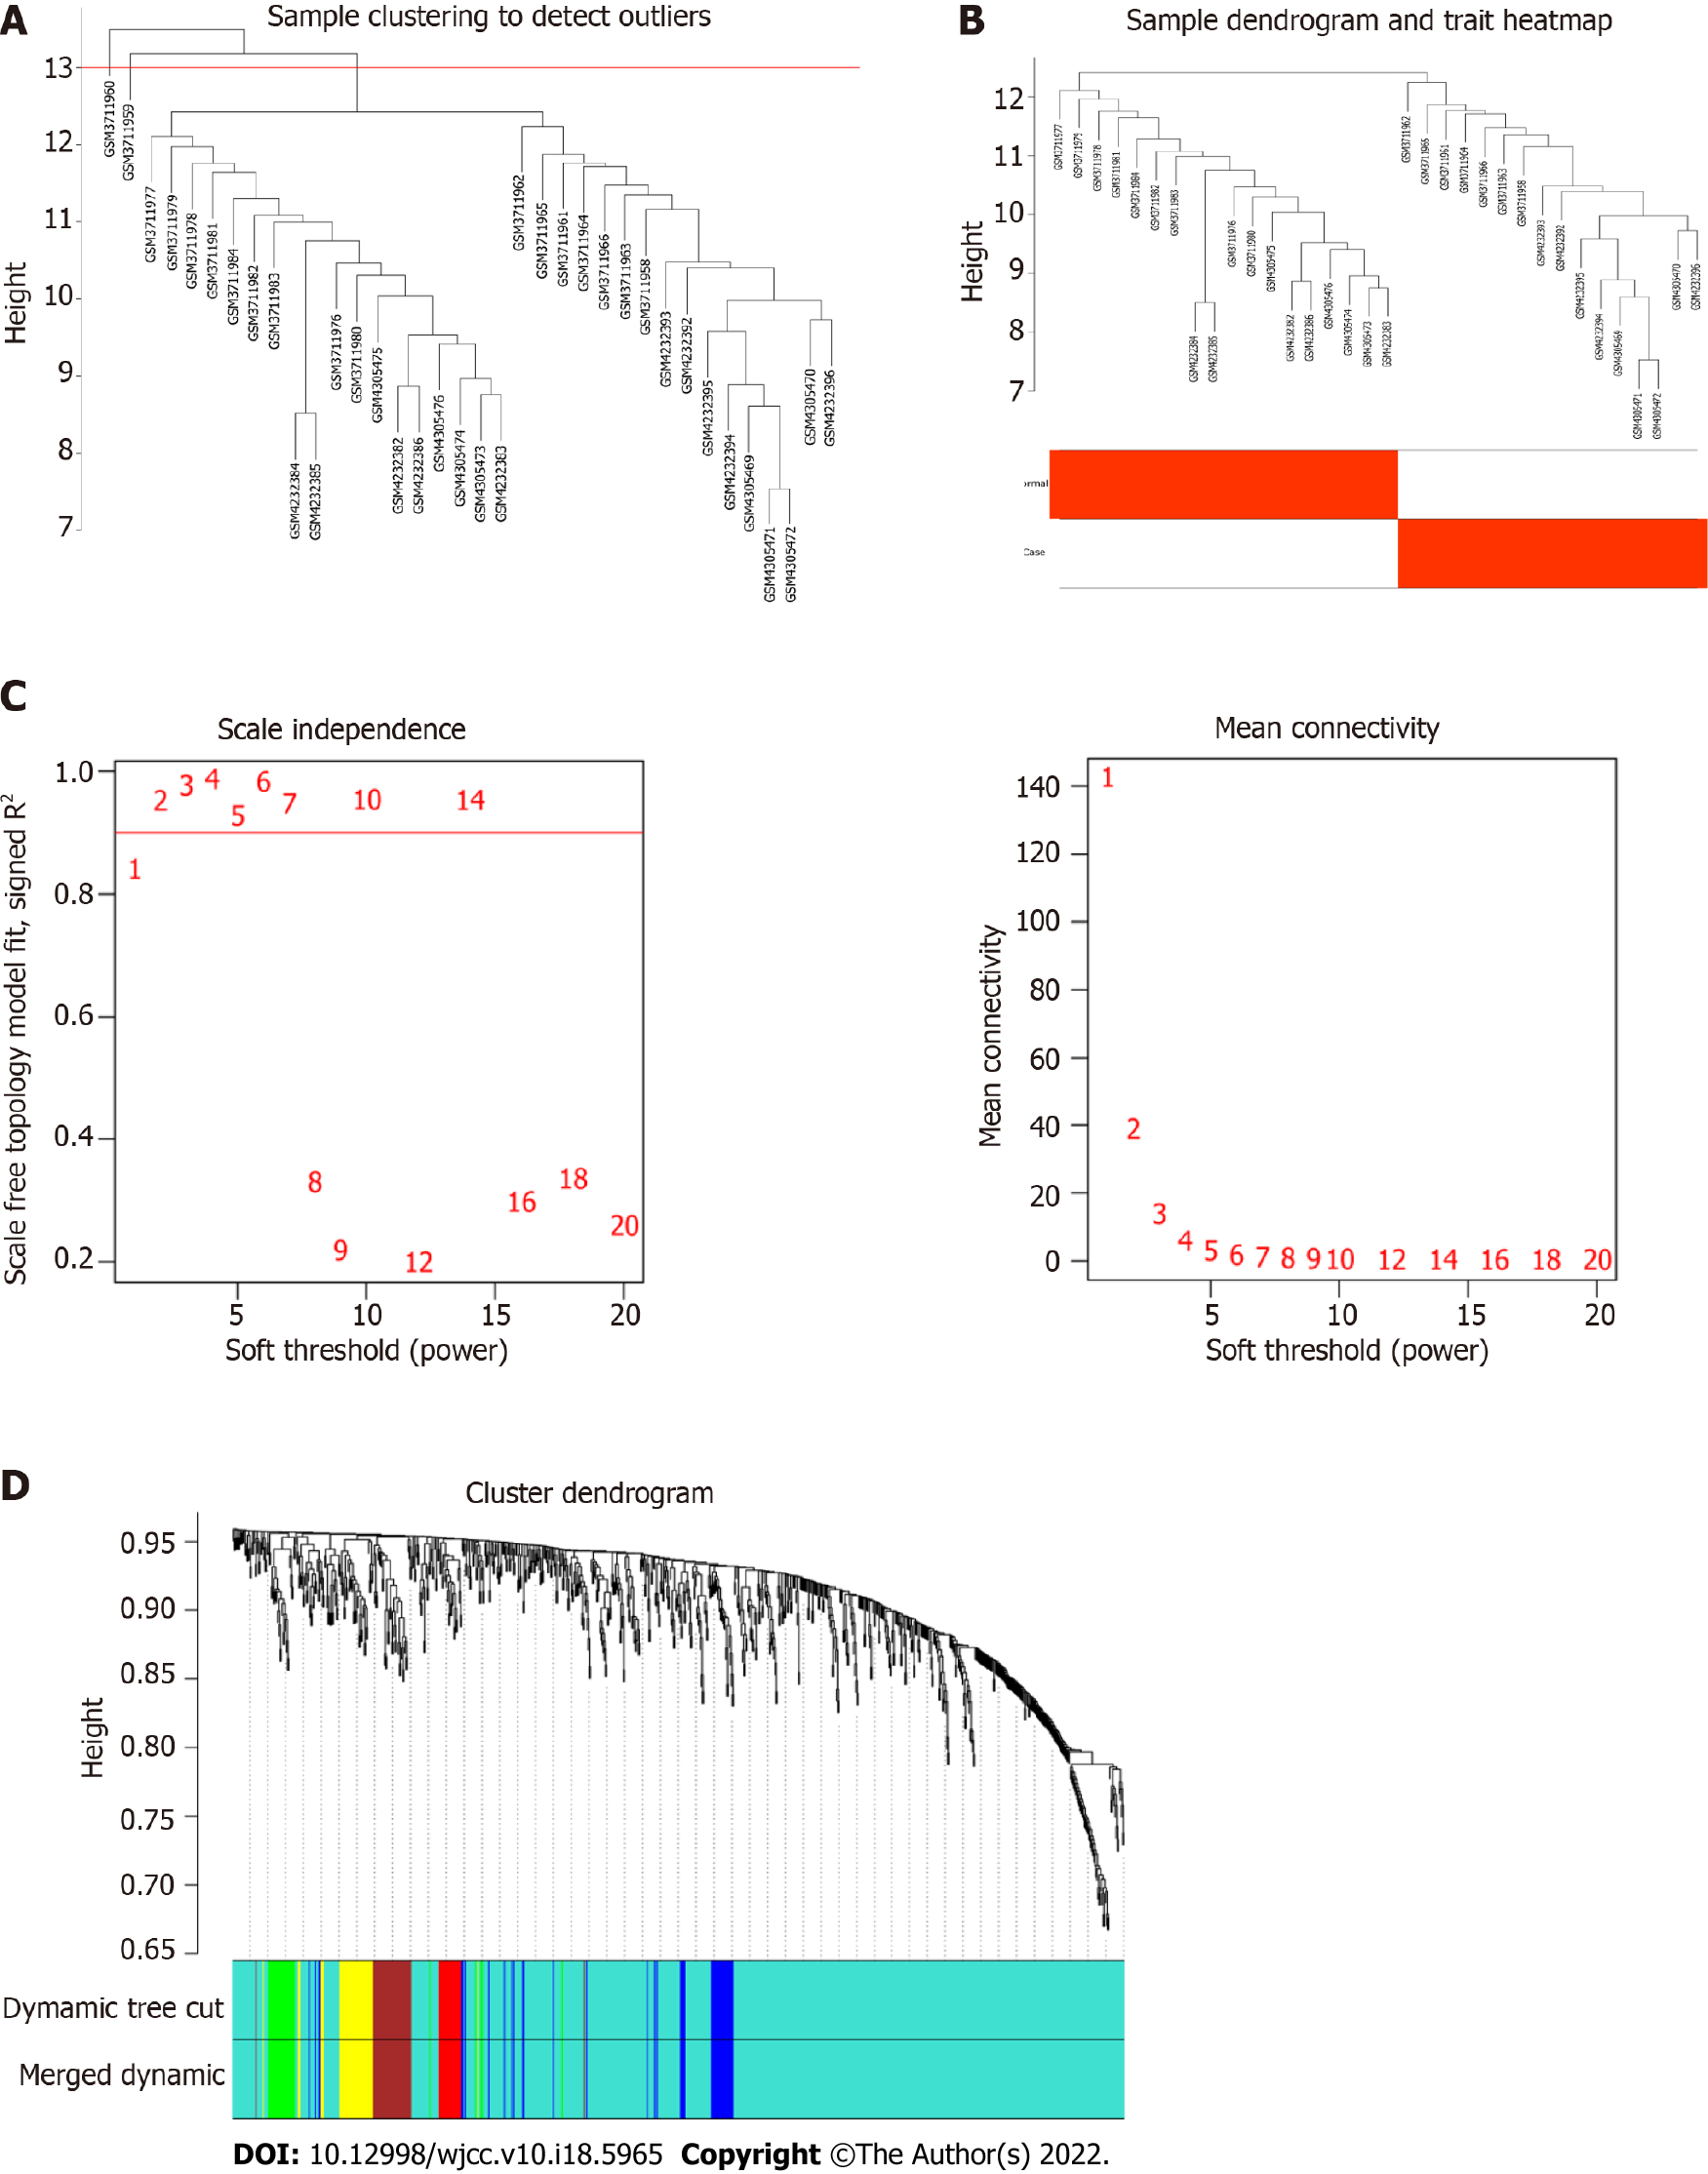
Figure 4 Construction of weighted gene co-expression network.
A: Sample screening dendrogram; B: Sample dendrogram and trait heat map; C: Scale-free fit index of different soft threshold power (β) and mean connectivity of various soft threshold power; D: The cluster dendrogram of the miRNAs. Each branch represents one gene, and every color below represents one module.
- Citation: Shu X, Chen XX, Kang XD, Ran M, Wang YL, Zhao ZK, Li CX. Identification of potential key molecules and signaling pathways for psoriasis based on weighted gene co-expression network analysis. World J Clin Cases 2022; 10(18): 5965-5983
- URL: https://www.wjgnet.com/2307-8960/full/v10/i18/5965.htm
- DOI: https://dx.doi.org/10.12998/wjcc.v10.i18.5965


