
















©The Author(s) 2022.
World J Clin Cases. Apr 26, 2022; 10(12): 3907-3915
Published online Apr 26, 2022. doi: 10.12998/wjcc.v10.i12.3907
Published online Apr 26, 2022. doi: 10.12998/wjcc.v10.i12.3907
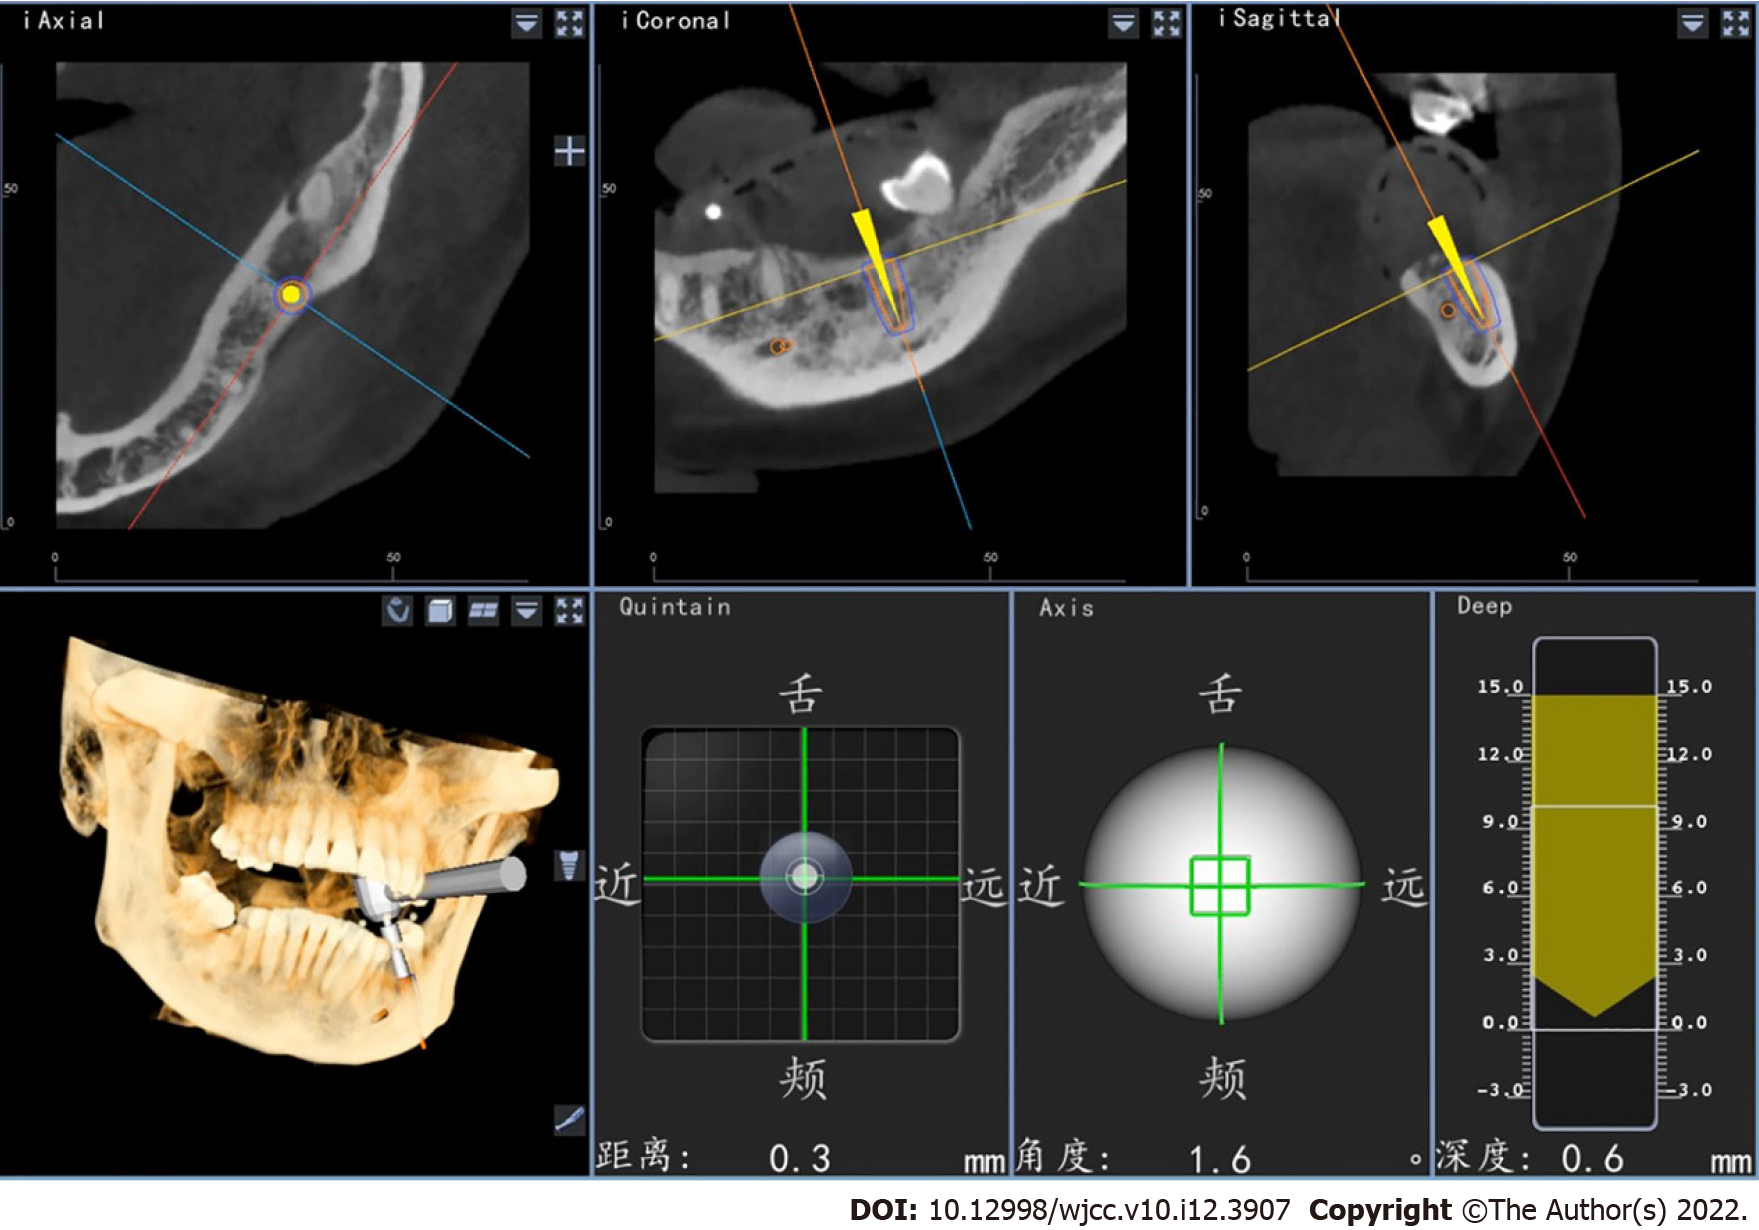
Figure 4 The navigation operation views are divided into dynamic and static views (Upper column is dynamic view, bottom columns are static views).
Upper column: 2D dynamic view: slice maps of the implant drill location (axial, coronal and sagittal views); Bottom column left 1: 3D reconstruction graph: hard tissue model; Bottom column left 2: Distance graph of the drill tip deviates from the designed implant entry point; Bottom column right 2: Angle graph of the drill deviates from the designed implant axis; Bottom column right 1: Depth map of the drill tip in the designed implant direction, green indicates that it can continue drilling, yellow indicates vigilance, red indicates excess (tolerance value can be artificially set).
- Citation: Chen LW, Zhao XE, Yan Q, Xia HB, Sun Q. Dynamic navigation system-guided trans-inferior alveolar nerve implant placement in the atrophic posterior mandible: A case report. World J Clin Cases 2022; 10(12): 3907-3915
- URL: https://www.wjgnet.com/2307-8960/full/v10/i12/3907.htm
- DOI: https://dx.doi.org/10.12998/wjcc.v10.i12.3907