
















©The Author(s) 2022.
World J Clin Cases. Apr 16, 2022; 10(11): 3615-3623
Published online Apr 16, 2022. doi: 10.12998/wjcc.v10.i11.3615
Published online Apr 16, 2022. doi: 10.12998/wjcc.v10.i11.3615
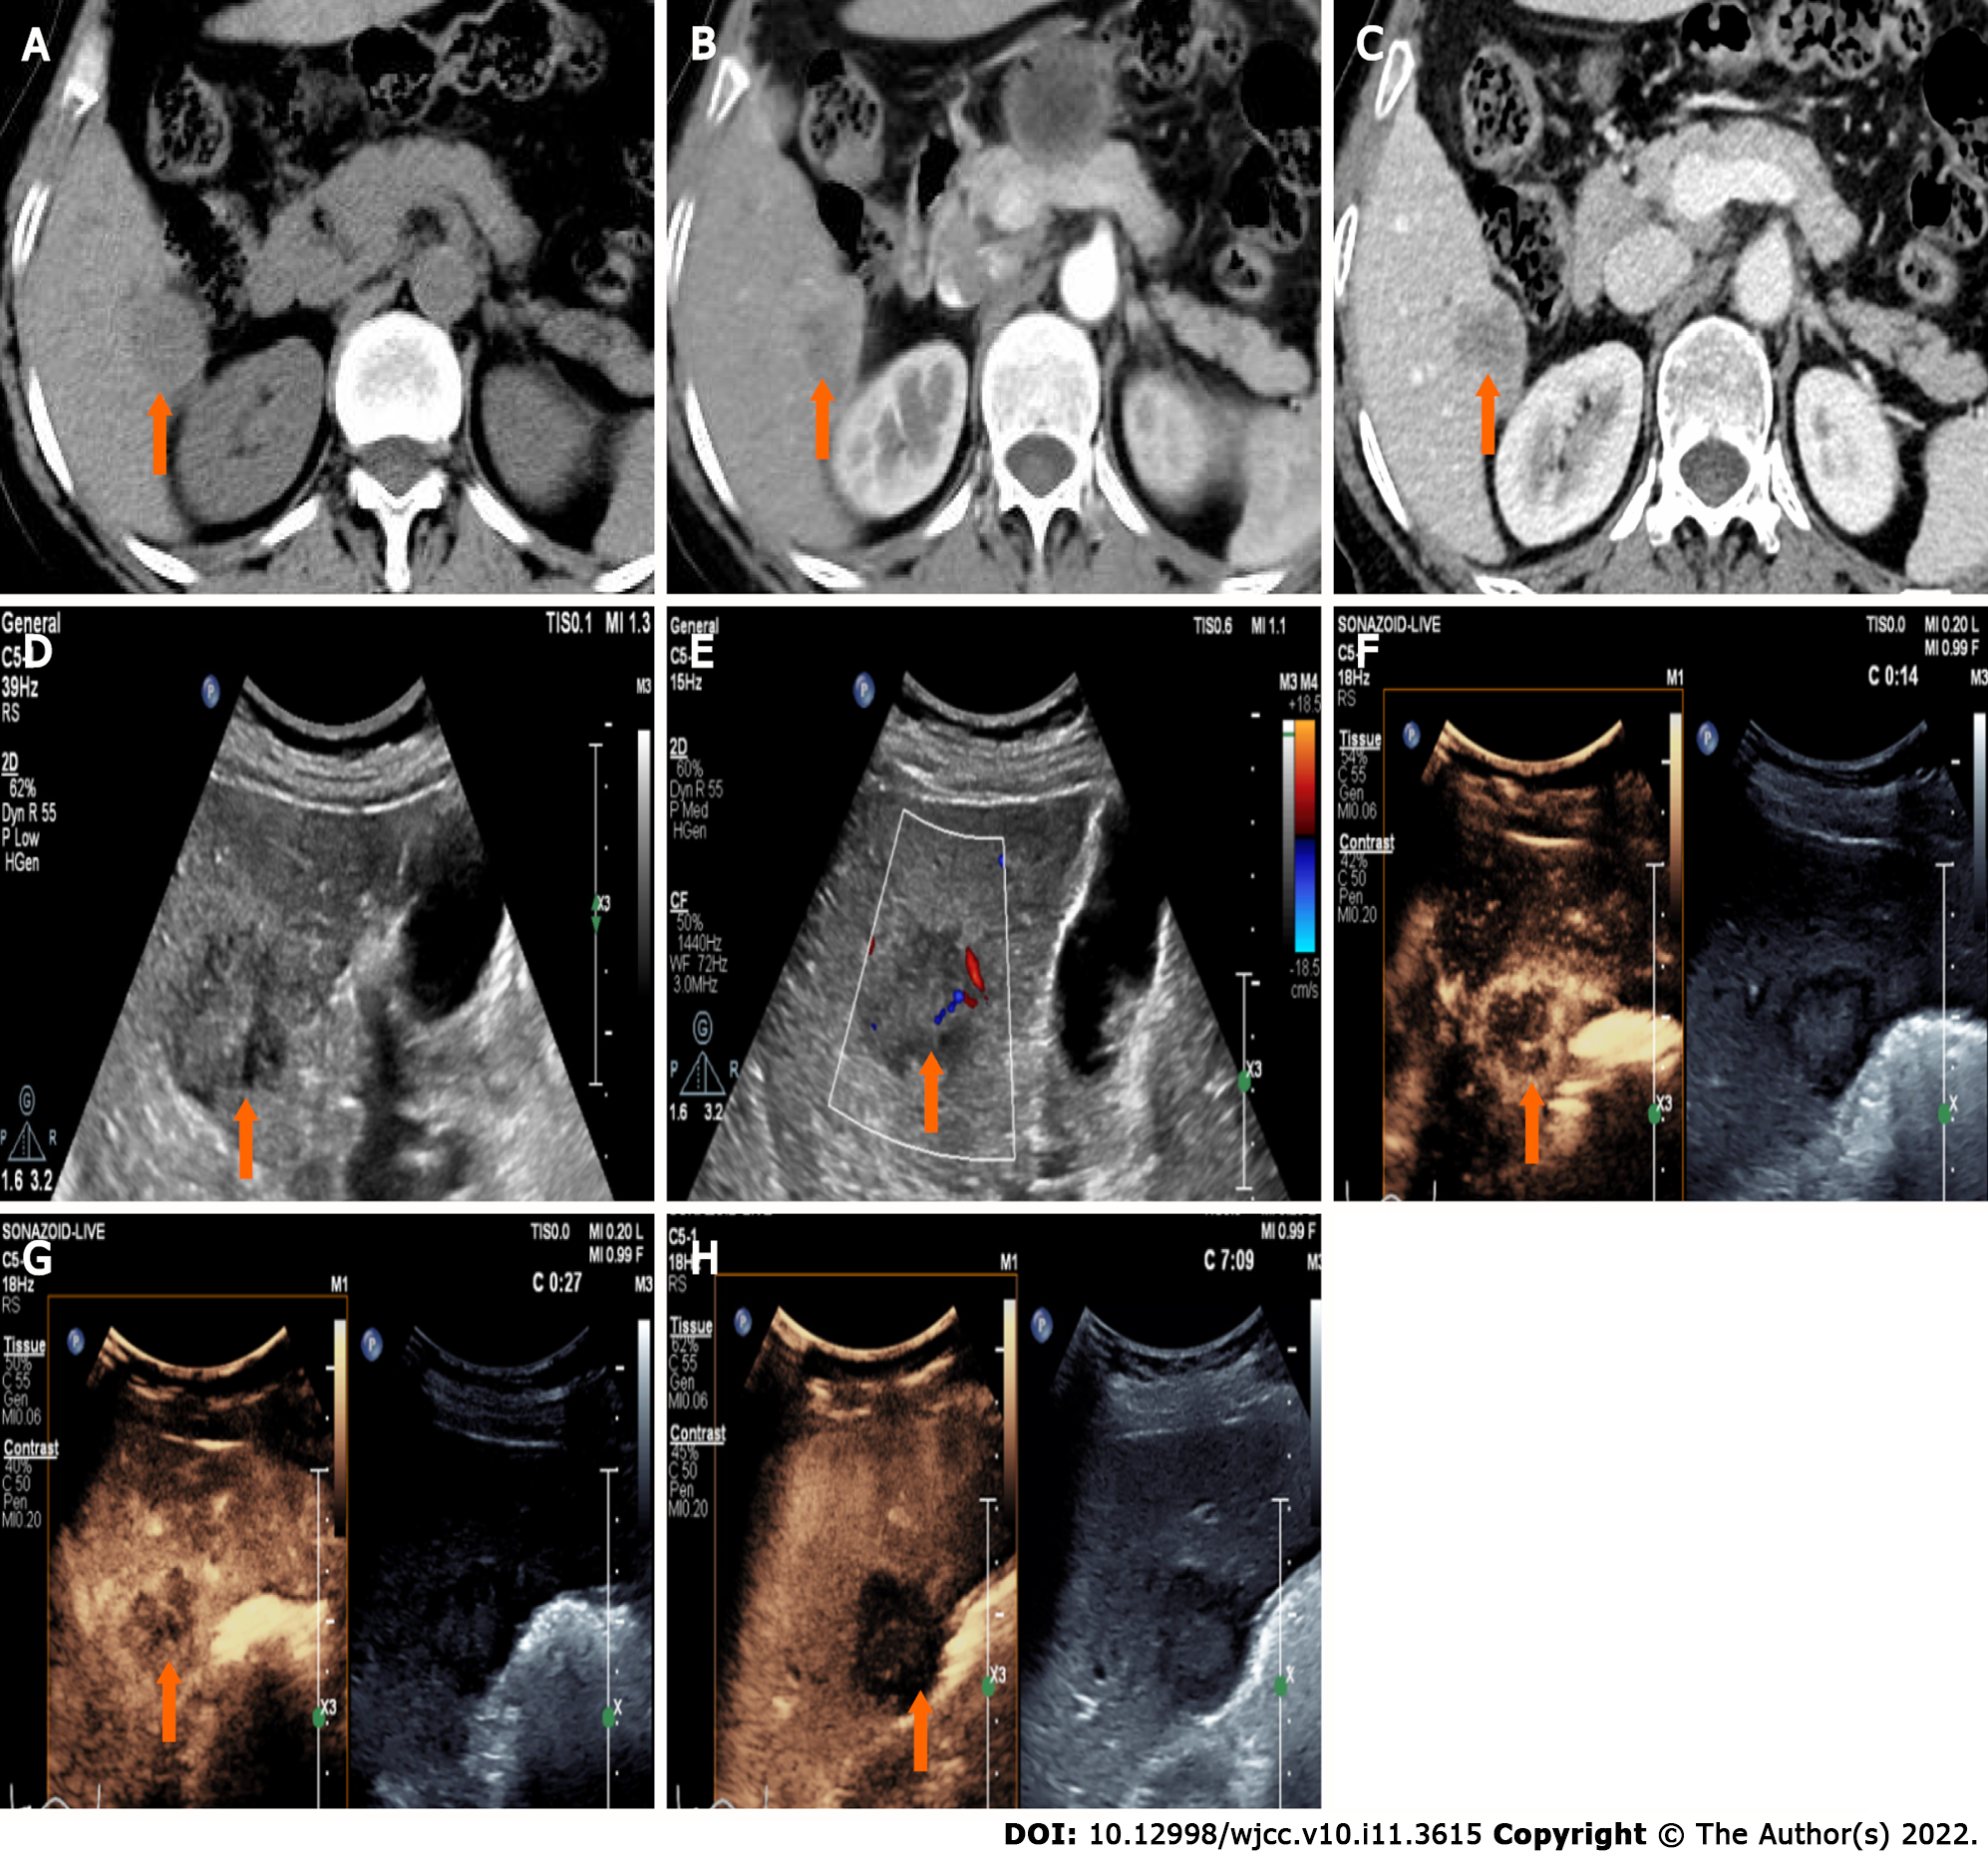
Figure 2 Contrast enhanced computed tomography and ultrasound images of a liver lesion in S6.
A: A low-density nodule measuring 3.0 cm × 2.7 cm was detected in liver S6 (A, arrow) on unenhanced computed tomography (CT); B and C: The lesion showed rim hyperenhancement in the arterial phase (B, arrow) followed by hypoenhancement (C, arrow) in the portal venous phase on contrast enhanced CT; D and E: The lesion presented a hypoechoic nodue with an unclear boundary and irregular shape (D, arrow); a sparse of blood flow was detected by color Doppler (E, arrow); F-H: The lesion manefested rapid rim hyperenhancement (F, arrow) and early washout (G, arrow) in the arterial phase, followed by marked washout in the late phase on contrast enhanced ultrasound.
- Citation: Gao L, Huang JY, Lu ZJ, Lu Q. Contrast-enhanced ultrasound manifestations of synchronous combined hepatocellular-cholangiocarcinoma and hepatocellular carcinoma: A case report. World J Clin Cases 2022; 10(11): 3615-3623
- URL: https://www.wjgnet.com/2307-8960/full/v10/i11/3615.htm
- DOI: https://dx.doi.org/10.12998/wjcc.v10.i11.3615