Copyright
©The Author(s) 2022.
World J Clin Cases. Jan 7, 2022; 10(1): 205-216
Published online Jan 7, 2022. doi: 10.12998/wjcc.v10.i1.205
Published online Jan 7, 2022. doi: 10.12998/wjcc.v10.i1.205
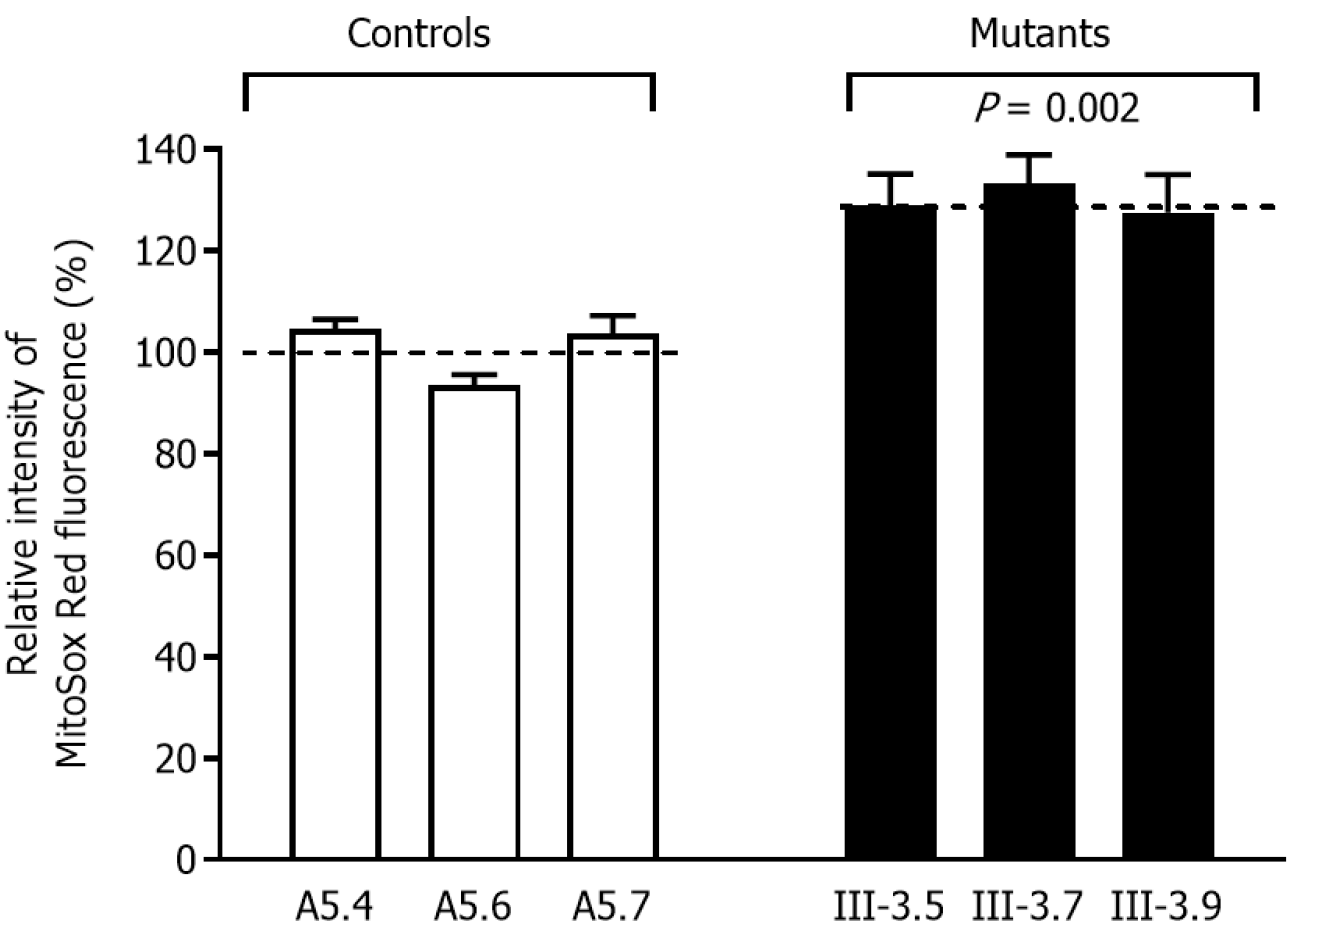
Figure 4 Measurement of reactive oxygen species production.
The relative ratio of intensity was calculated in three cybrid cell lines derived from one Chinese control subject and cybrid cell lines. The values for the latter are expressed as percentages of the average values for the control cell lines. The average of three determinations for each cell line is shown. The error bars indicate two standard errors of the means. A P value indicates significance, according to the t-test, of the differences between mutant and control cell lines.
- Citation: Zhao LJ, Zhang ZL, Fu Y. Novel m.4268T>C mutation in the mitochondrial tRNAIle gene is associated with hearing loss in two Chinese families. World J Clin Cases 2022; 10(1): 205-216
- URL: https://www.wjgnet.com/2307-8960/full/v10/i1/205.htm
- DOI: https://dx.doi.org/10.12998/wjcc.v10.i1.205


