Copyright
©The Author(s) 2021.
World J Clin Cases. Feb 26, 2021; 9(6): 1386-1393
Published online Feb 26, 2021. doi: 10.12998/wjcc.v9.i6.1386
Published online Feb 26, 2021. doi: 10.12998/wjcc.v9.i6.1386
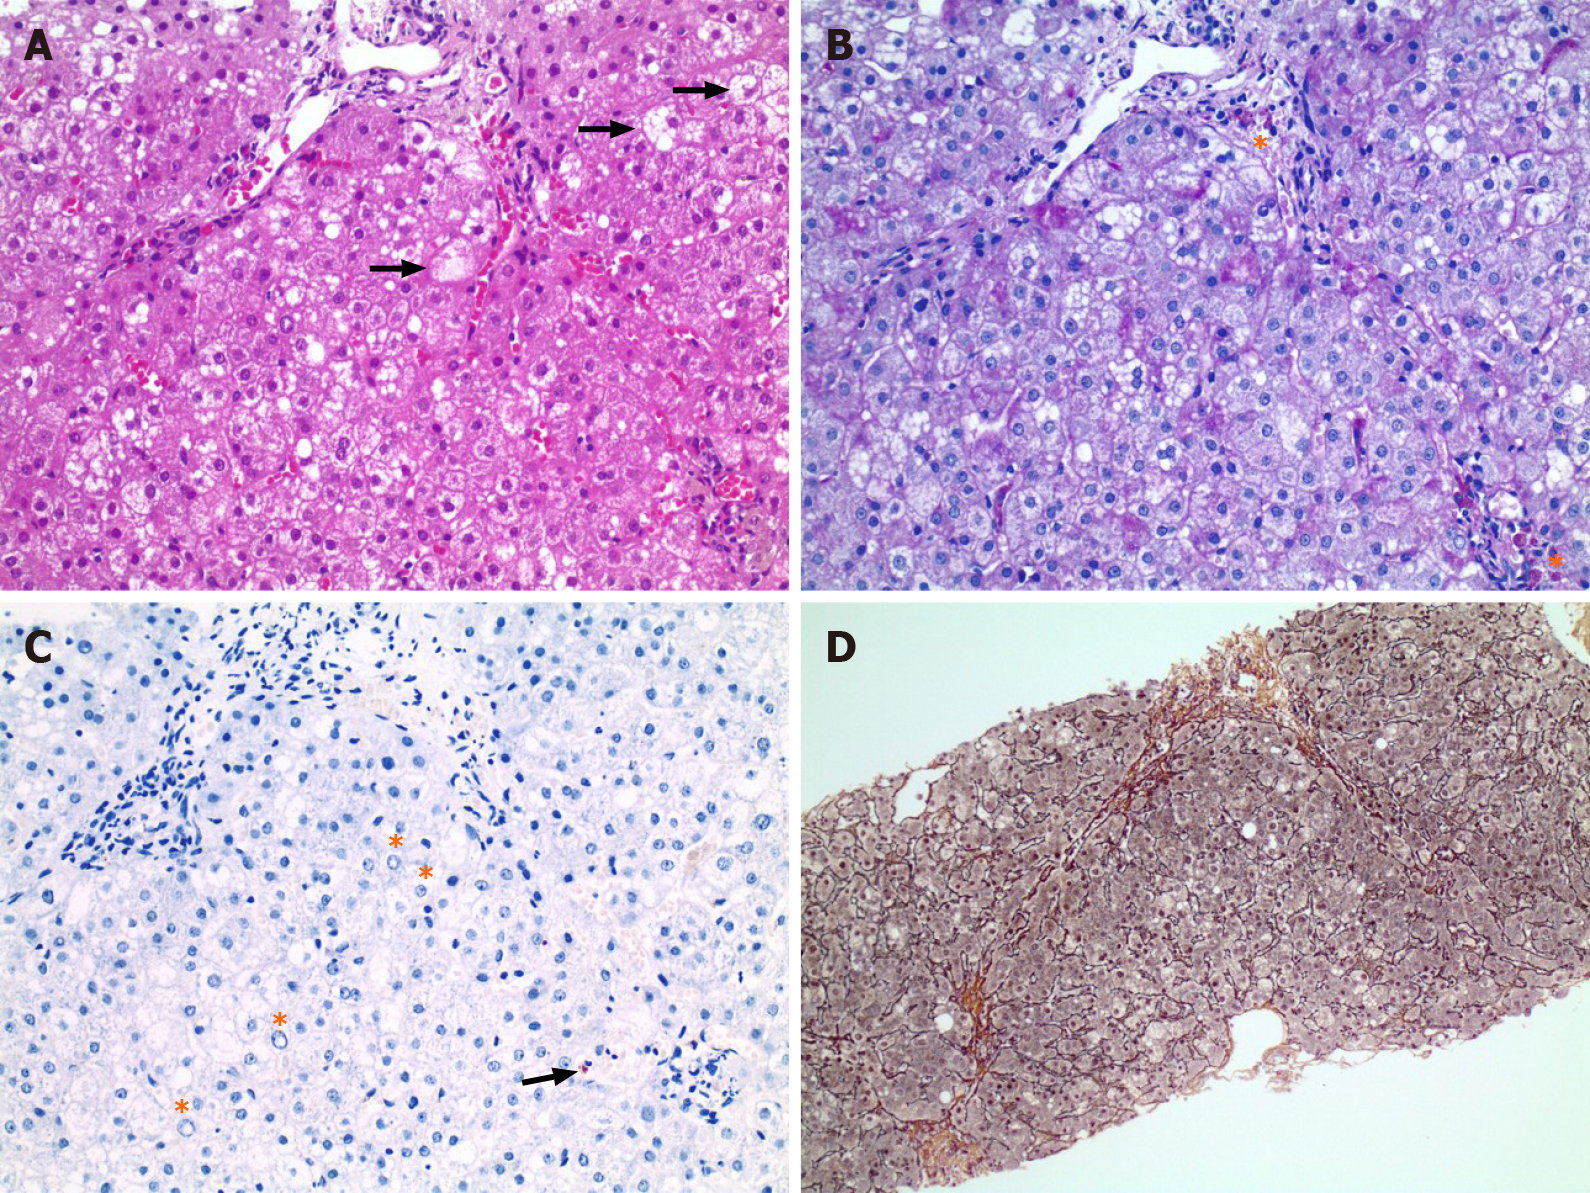
Figure 1 The liver biopsy images.
A: Liver biopsy revealing mild microvesicular steatosis as several single as well as grouped ballooned hepatocytes (arrows, hematoxylin-eosin); B: Ceroid-laden macrophages (asterisks) are present in portal tracts indicating past cell damage (D-Periodic Acid-Schiff); C: Copper staining revealed mild copper accumulation (arrow). Note, several glycogenated nuclei (asterisk); D: Mild portal, perisinusoidal and initial septal fibrosis (modified Gomori). Original magnification: 200-fold.
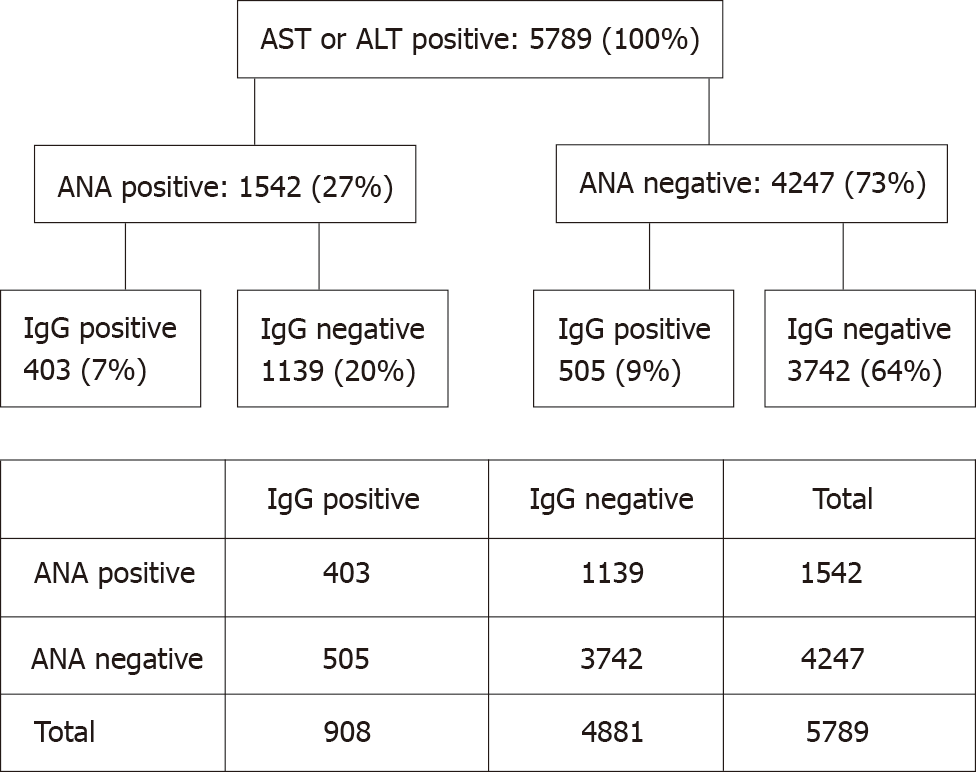
Figure 2 Elevated transaminases (aspartate aminotransferase or alanine aminotransferase) as function of antinuclear antibodies and immunoglobulin G levels.
Statistical analysis calculated the difference in prevalence of liver inflammation between the groups. The Chi2 statistics with Yates correction is 172.484. The P value is < 0.00001. ANA: Antinuclear antibodies; ALT: Alanine aminotransferase; AST: Aspartate aminotransferase.
- Citation: Stremmel W, Longerich T, Liere R, Vacata V, van Helden J, Weiskirchen R. Wilson disease — the impact of hyperimmunity on disease activity: A case report. World J Clin Cases 2021; 9(6): 1386-1393
- URL: https://www.wjgnet.com/2307-8960/full/v9/i6/1386.htm
- DOI: https://dx.doi.org/10.12998/wjcc.v9.i6.1386


