Copyright
©The Author(s) 2020.
World J Clin Cases. Nov 6, 2020; 8(21): 5415-5419
Published online Nov 6, 2020. doi: 10.12998/wjcc.v8.i21.5415
Published online Nov 6, 2020. doi: 10.12998/wjcc.v8.i21.5415
Figure 1 Contrast-enhanced computed tomography scan of the gallbladder.
A: Nodular in low density shadow, about 31 mm × 23 mm size; B: Arterial enhancement scanning, computed tomography value of 47 HU; C: Venous phase computed tomography value of 51 HU; D: Delayed computed tomography value of 42 HU. Arrows in the figures indicate irregular cauliflower-shaped mass measuring 38 mm × 32 mm with its base connected to the gallbladder wall.
Figure 2 Magnetic resonance imaging scan of the gallbladder.
Signals of T1-weighted imaging (A) and T2-weighted imaging (B) are equal. Diffusion-weighted imaging signal (C) was low. Arrows in the figures indicate irregular cauliflower-shaped mass with its wide base connected to the gallbladder wall. T1WI: T1-weighted imaging; T2WI: T2-weighted imaging; DWI: Diffusion-weighted imaging.
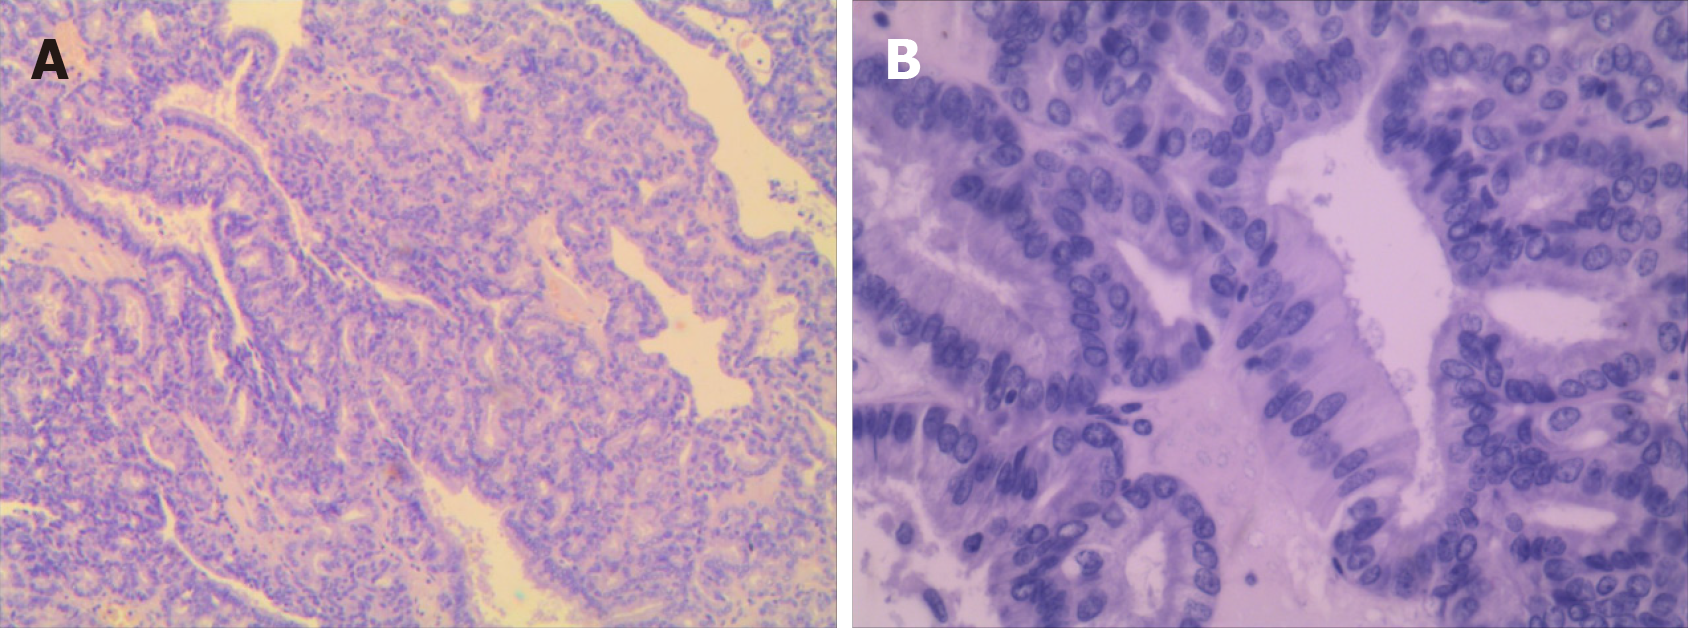
Figure 3 Hematoxylin and eosin staining of surgically resected gallbladder tumor.
A: Magnification (10 ×); B: Magnification (40 ×). Image shows adenoma with moderate epithelial atypia, and moderate atypia in the focal area with fine pedicle and no clear infiltration.
- Citation: Cao LL, Shan H. Large and unusual presentation of gallbladder adenoma: A case report. World J Clin Cases 2020; 8(21): 5415-5419
- URL: https://www.wjgnet.com/2307-8960/full/v8/i21/5415.htm
- DOI: https://dx.doi.org/10.12998/wjcc.v8.i21.5415


