Copyright
©The Author(s) 2019.
World J Clin Cases. Jan 26, 2019; 7(2): 145-155
Published online Jan 26, 2019. doi: 10.12998/wjcc.v7.i2.145
Published online Jan 26, 2019. doi: 10.12998/wjcc.v7.i2.145
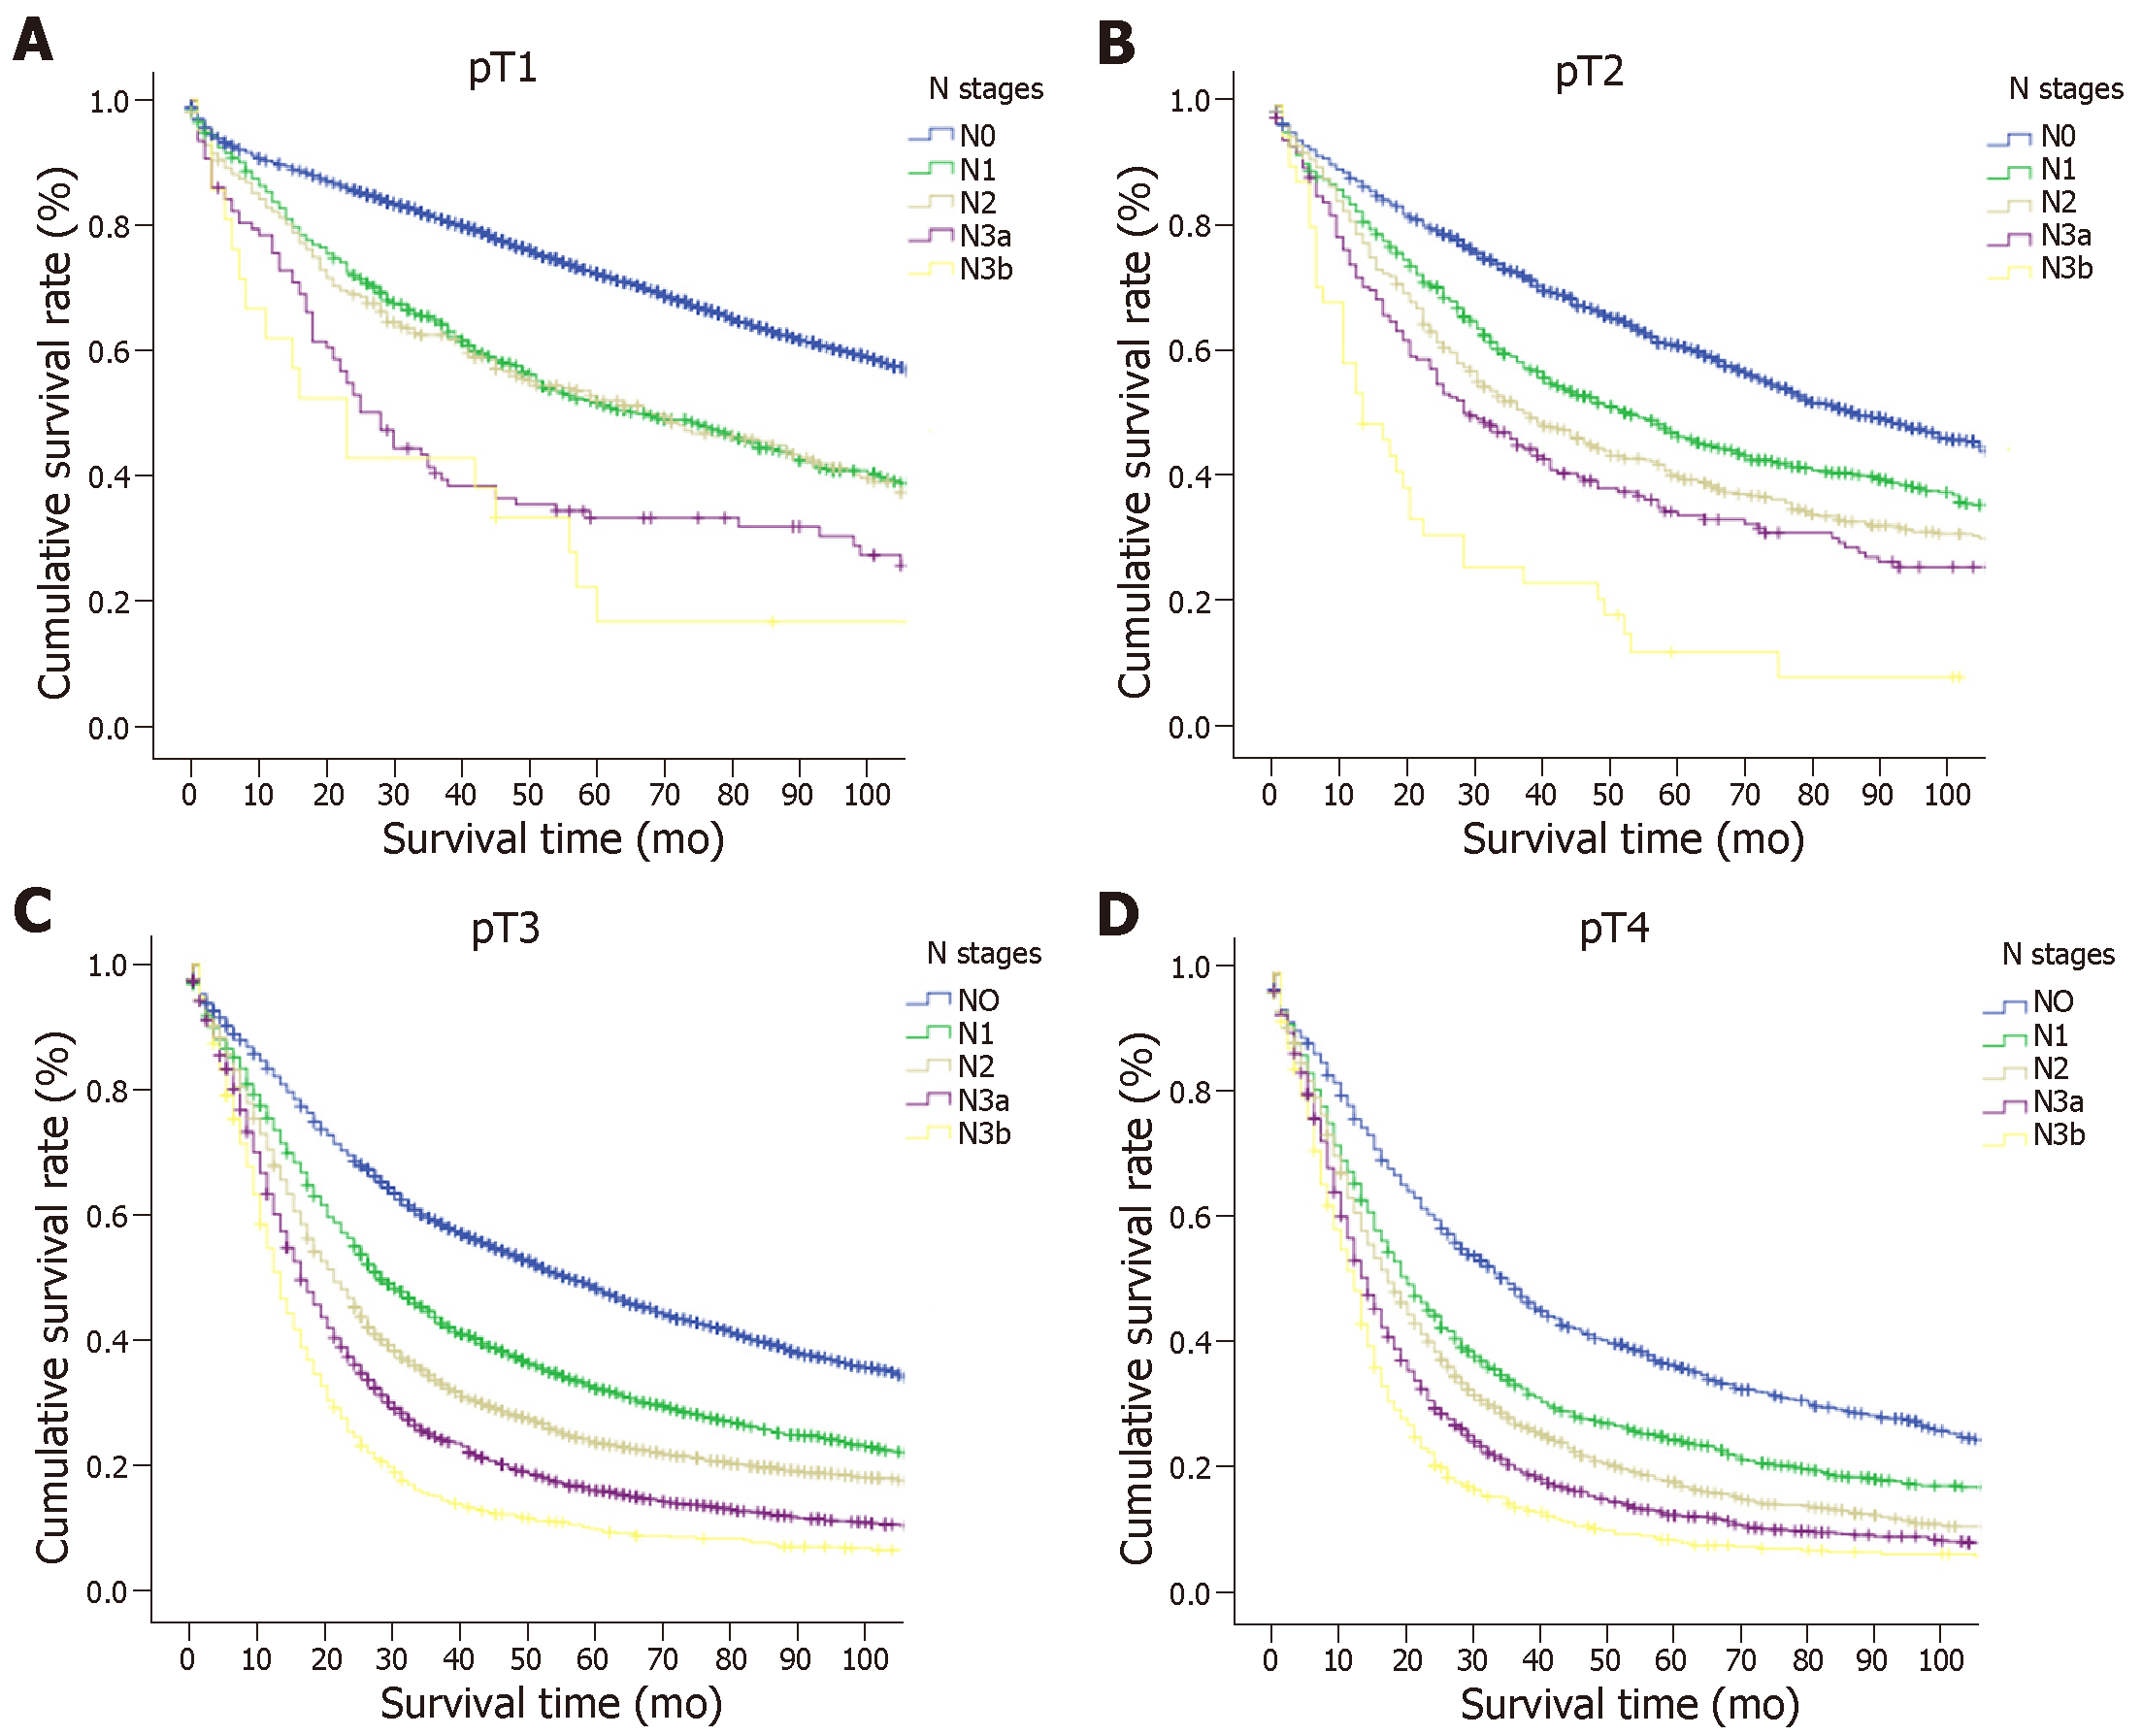
Figure 1 Comparison of the survival for each N classification in the same T category of gastric cancer.
A: pT1 patients; B: pT2 patients; C: pT3 patients; D: pT4a patients.
Figure 2 X-tile analysis of survival data from the Surveillance, Epidemiology, and End Results registry reveals a continuous distribution based on the number of metastatic lymph nodes.
A-C: The optimal cut-point highlighted by the black circle (C) is shown on a histogram of the entire cohort (B), and a Kaplan-Meier plot (A). P-values were determined by using the cut-point. It shows that the optimal cutoff point of the N category is 6 (χ2 = 165.38, P < 0.001). LNs: Lymph nodes.
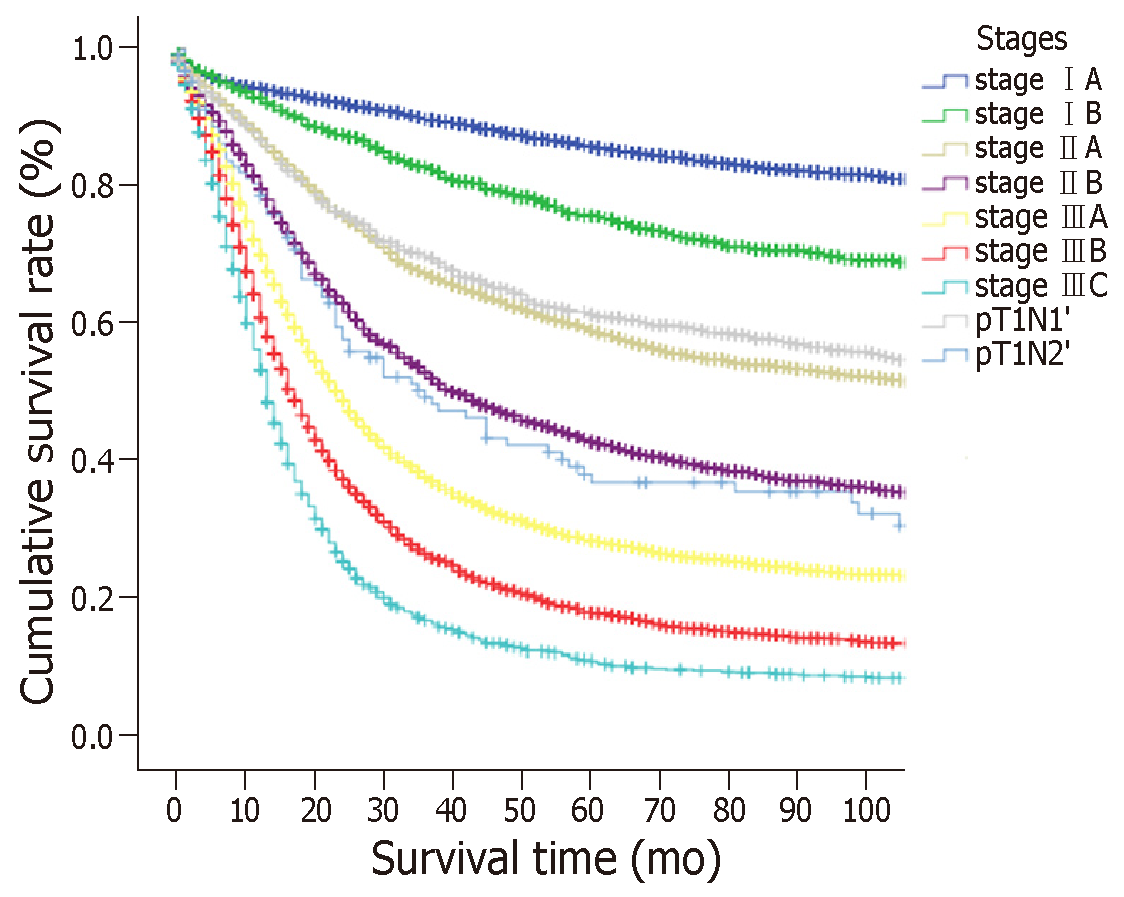
Figure 3 Comparison of the overall survival of patients with T1N1’ and T1N2’ stages to the stages according to the eighth edition of the tumor lymph node metastasis staging system for gastric cancer.
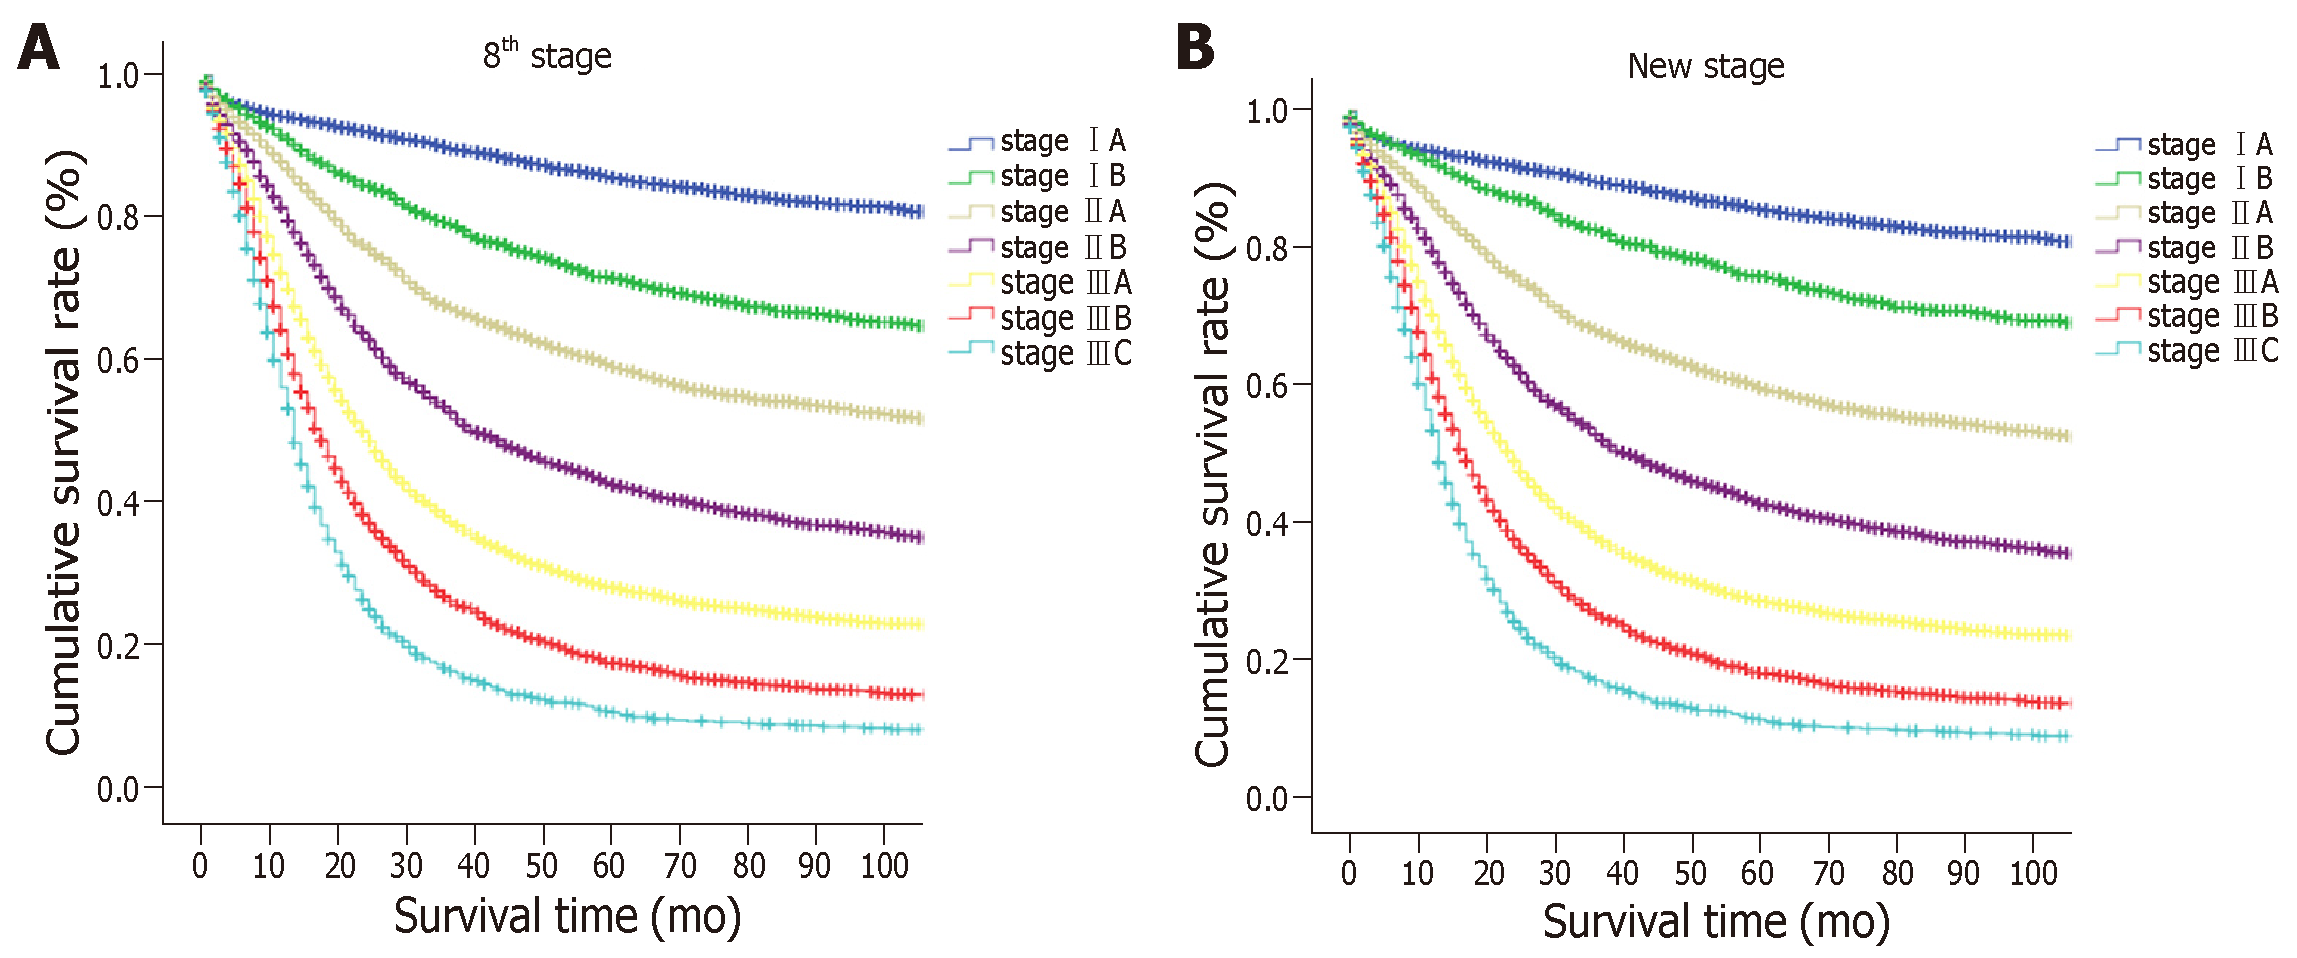
Figure 4 Difference in the two classifications for gastric cancer patients.
A: The eighth edition tumor lymph node metastasis (TNM) staging system; B: The new TNM staging system.
Figure 5 Survival curves of the Surveillance, Epidemiology, and End Results data set for gastric cancer patients.
A: The eighth edition tumor lymph node metastasis (TNM) staging system; B: The new TNM staging system.
- Citation: Lin JX, Lin JP, Li P, Xie JW, Wang JB, Lu J, Chen QY, Cao LL, Lin M, Tu RH, Zheng CH, Huang CM. New metastatic lymph node classification for early gastric cancer should differ from those for advanced gastric adenocarcinoma: Results based on the SEER database. World J Clin Cases 2019; 7(2): 145-155
- URL: https://www.wjgnet.com/2307-8960/full/v7/i2/145.htm
- DOI: https://dx.doi.org/10.12998/wjcc.v7.i2.145


