Copyright
©The Author(s) 2018.
World J Clin Cases. Oct 26, 2018; 6(12): 548-553
Published online Oct 26, 2018. doi: 10.12998/wjcc.v6.i12.548
Published online Oct 26, 2018. doi: 10.12998/wjcc.v6.i12.548
Figure 1 Abdominal ultrasonography shows mosaic echoic tumor at ventromedian.
Tumor has poor blood flow signal and a linear hyperechoic part inside and a clear border to the surroundings.
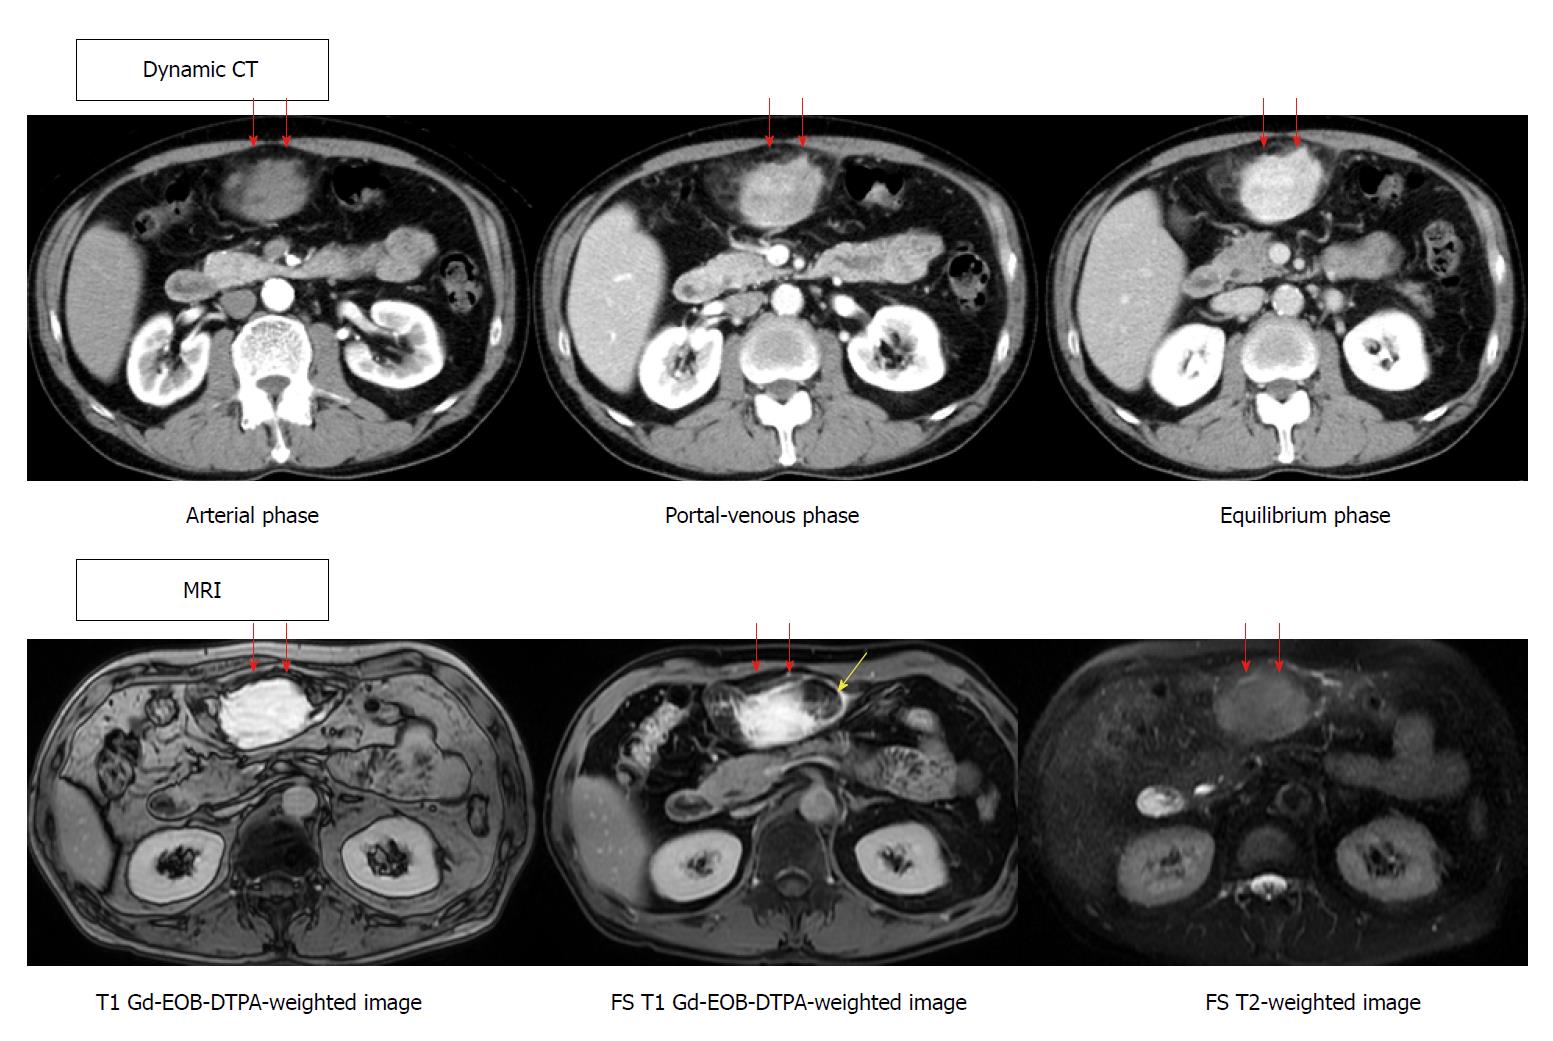
Figure 2 Dynamic CT and MRI of the abdomen show a ventromedian tumor in front of pancreas.
CT reveals high enhanced effect of tumor from portal-venous phase continuing to the equilibrium phase (red arrow). T1-weighted gadolinium-ethoxybenzyl-diethylenetriamine pentaacetic acid-enhanced image revealed a high intensity effect at the early phase, which continued to the next phase (red arrow). In addition, it showed a partial low intensity area by a fat suppression image (yellow arrow). On the other hand, the T2-weighted image did not show a high intensity effect. Gd: Gadolinium; EOB: Ethoxybenzyl; DTPA: Diethylenetriamine pentaacetic acid-enhanced; FS: Fat suppression.
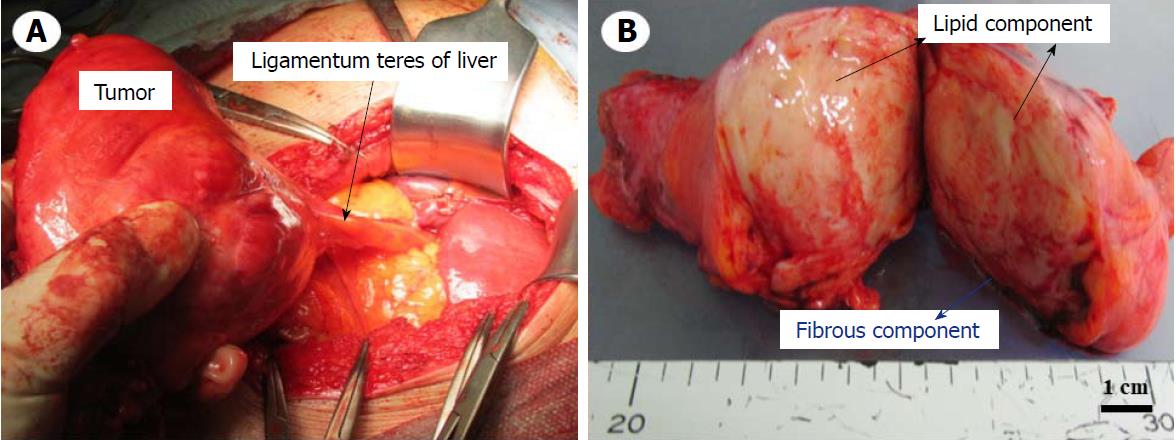
Figure 3 Intraoperative finding and macroscopic view of the resected split specimen.
A: A tumor arising from the ligamentum teres of liver; B: A tumor measuring a maximum of 13 cm × 9 cm × 5 cm consisting of yellow lipid and a white fibrous component.
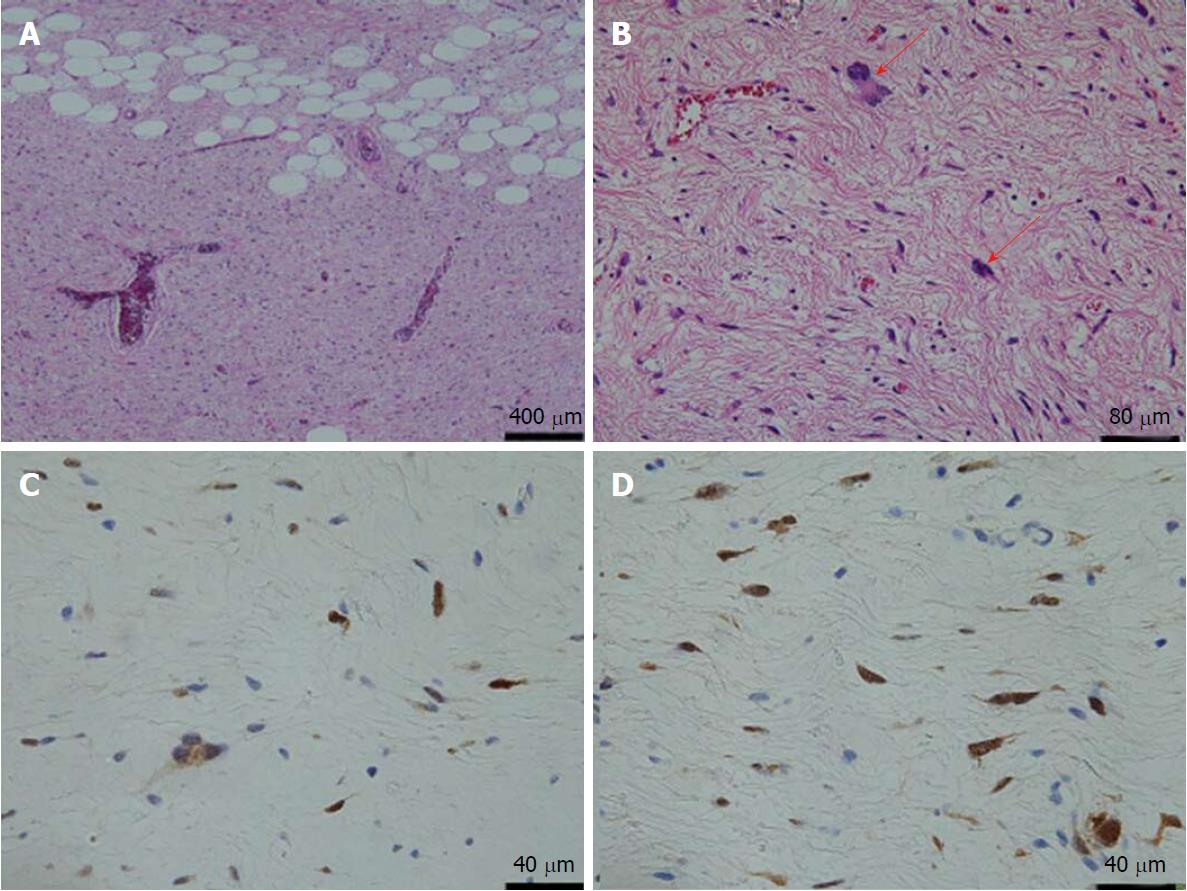
Figure 4 Microscopic view of the resected specimen.
A: Lipid and fibrous component are confirmed. Lipid component consist of mature adipocytes. Hematoxylin and eosin staining (× 40); B: Deep dyeing multiforme or multinuclear atypical stromal cells are confirmed in fibrous component (red arrow). Hematoxylin and eosin staining (× 200); C: Immunostaining showed that atypical stromal cells were positive for MDM2 (× 400); D: Immunostaining showed that atypical stromal cells were positive for CDK4 (× 400).
- Citation: Usuda D, Takeshima K, Sangen R, Nakamura K, Hayashi K, Okamura H, Kawai Y, Kasamaki Y, Iinuma Y, Saito H, Kanda T, Urashima S. Atypical lipomatous tumor in the ligamentum teres of liver: A case report and review of the literature. World J Clin Cases 2018; 6(12): 548-553
- URL: https://www.wjgnet.com/2307-8960/full/v6/i12/548.htm
- DOI: https://dx.doi.org/10.12998/wjcc.v6.i12.548


