Copyright
©The Author(s) 2017.
World J Clin Cases. Mar 16, 2017; 5(3): 82-92
Published online Mar 16, 2017. doi: 10.12998/wjcc.v5.i3.82
Published online Mar 16, 2017. doi: 10.12998/wjcc.v5.i3.82
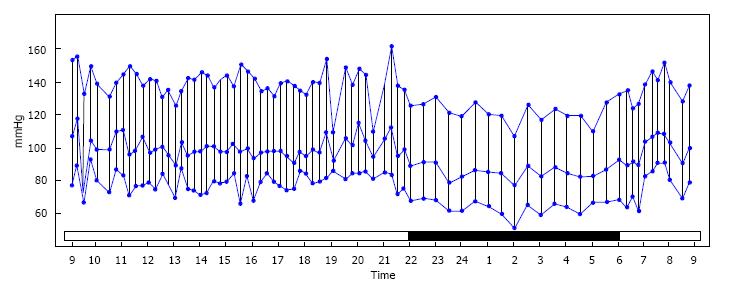
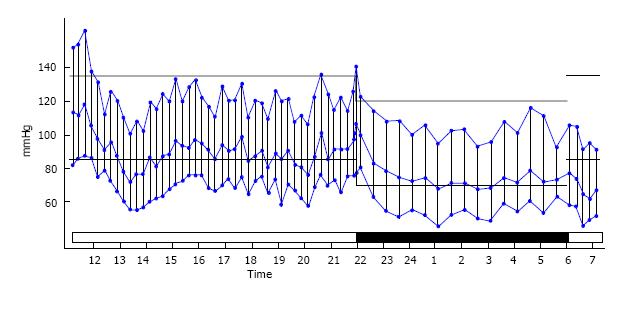
Figure 1 Normal 24 h ambulatory blood pressure recording.
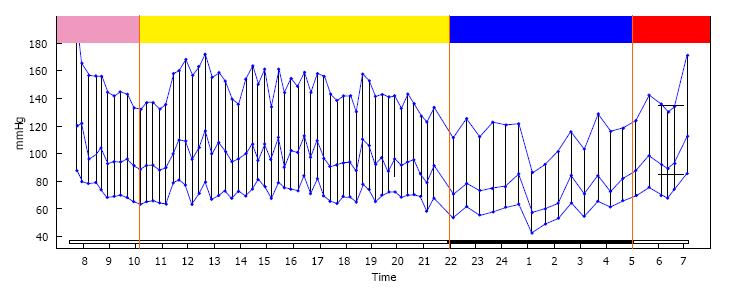
In all the figures, the simultaneous systolic and diastolic blood pressure values are connected by vertical lines. The blue line within the verticals is the mean blood pressure. The recorded pressure in mmHg is noted on the vertical axis. At the time of recording, recognized normal values, represented by light horizontal lines, were 135 mmHg systolic and 85 mmHg diastolic during the daytime and 120 mmHg systolic and 70 mmHg diastolic during sleep. The 24 h time of recording is noted on the horizontal axis. The solid black horizontal bar represents the sleep period.
Figure 2 The four time segments of the recording.
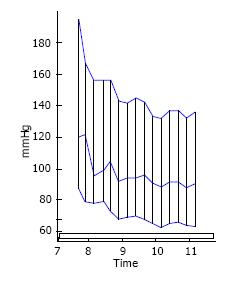
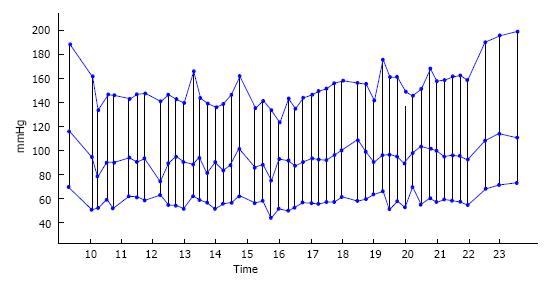
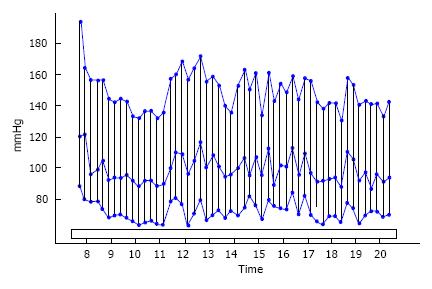
Figure 3 The hospital-induced bimodal blood pressure fall of the white coat effect.
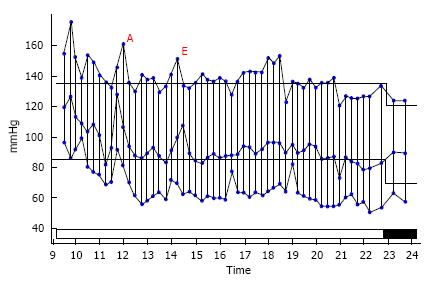
Figure 4 The pressure elevation from exercise (E) and strenuous activity (A).
Figure 5 White coat hypertension with superimposed essential systolic hypertension reflected in the rising pressure in the afternoon and evening.
Figure 6 Essential hypertension with an initial classical white coat configuration.
Figure 7 The night-time dip.
A classical white coat pattern during day time with a normal sleep time pressure dip of 20 mmHg.
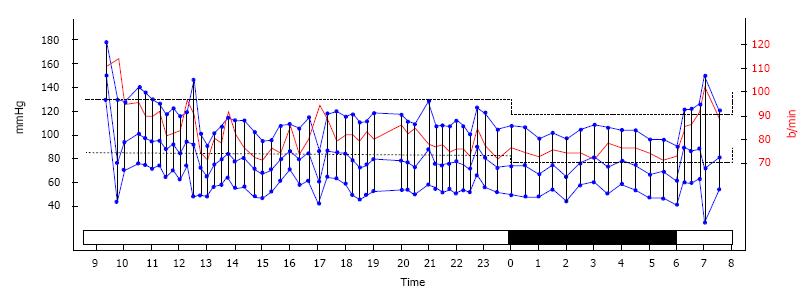
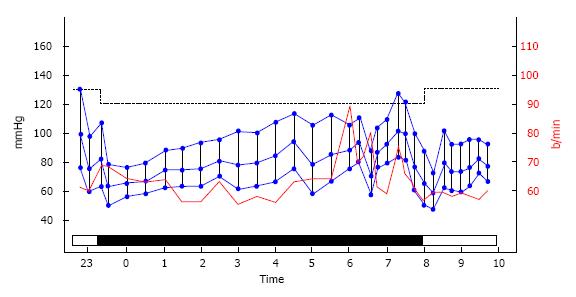
Figure 8 White coat hypertension with a blunted night time dip.
The recorded pressure in mmHg is noted on the left vertical axis. The pulse pressure in beats per minute is noted on the right vertical axis. The 24 h time of recording is noted on the horizontal axis. The solid black horizontal bar represents the sleep period.
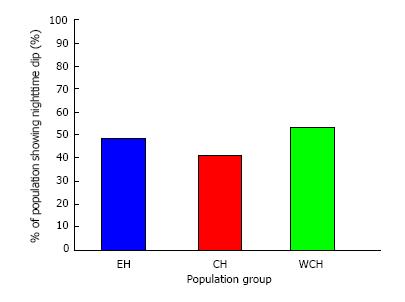
Figure 9 Similar percentage of blunted nighttime dippers in medicated but uncontrolled essential hypertensives, medicated controlled hypertensives, and medicated white coat hypertensives.
EH: Essential hypertensives; CH: Controlled hypertensives; WCH: White coat hypertensives.
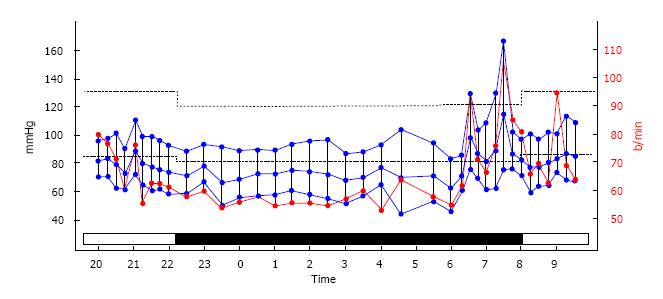
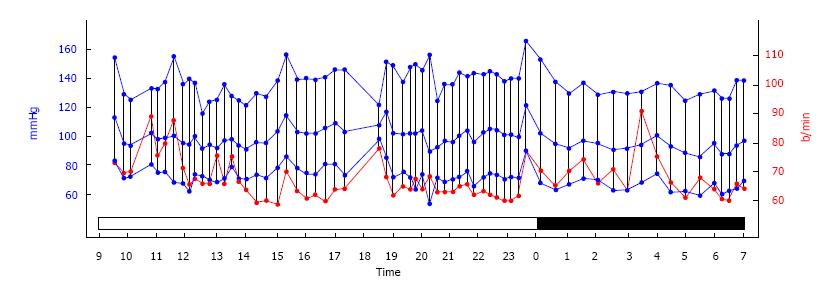
Figure 10 Elevated nighttime blood pressure and pulse rate.
The recorded pressure in mmHg is noted on the left vertical axis. Right axis shows the recorded pulse rate in beats per minute. Horizontal axis displays the 24 h time with black bar indicates the sleep period.
Figure 11 Pressure and pulse rate rise during a nightmare at 7:30 am.
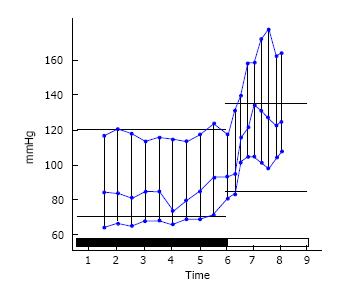
Figure 12 The “morning surge” upon awakening.
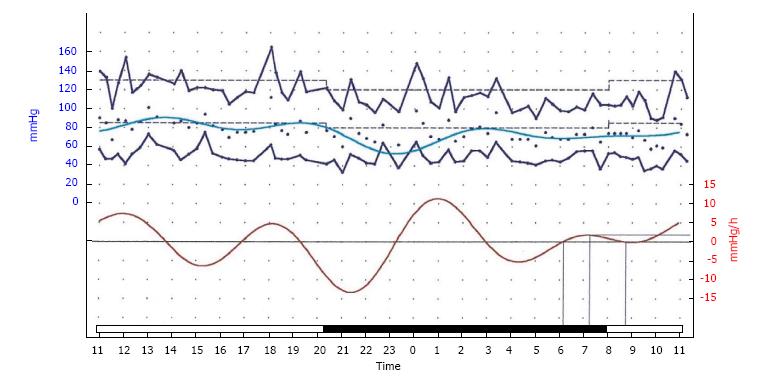
Figure 13 Rate of rise and fall of systolic pressure during the 24 h.
The rate is shown by the red line with the mmHg rise/hour noted on the right vertical axis.
Figure 14 Diastolic white coat hypertension.
Office blood pressure recorded repeatedly over two years ranged from 130-140 mmHg systolic and 95-100 mmHg diastolic. Ambulatory blood pressure monitoring shows stable systolic pressure while the diastolic pressure falls into the 60-70 mmHg range.
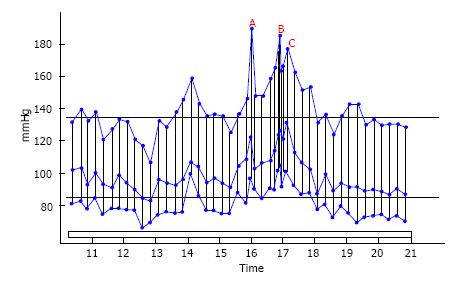
Figure 15 Triggers and aggravation.
“A” represents pressure upon arriving at the doctor’s office, “B” on entering the consulting room, and “C” on applying the pressure cuff to the arm and recording the blood pressure. The pressure peak at 1400 h represented a prolonged argument with the patient’s cable TV company.
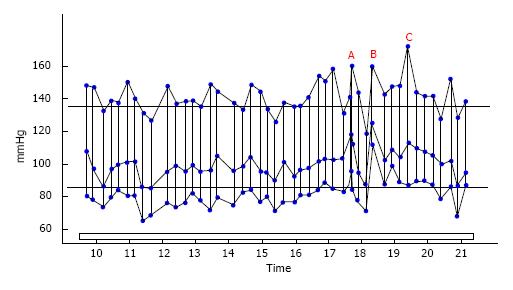
Figure 16 Triggers and anxiety.
The pressures indicated by A, B and C represent the same activity as shown in figure 15. The preceding multiple pressure peaks represent the anticipatory anxiety and concern regarding the visit to the doctor.
- Citation: Bloomfield DA, Park A. Decoding white coat hypertension. World J Clin Cases 2017; 5(3): 82-92
- URL: https://www.wjgnet.com/2307-8960/full/v5/i3/82.htm
- DOI: https://dx.doi.org/10.12998/wjcc.v5.i3.82


