Copyright
©The Author(s) 2017.
World J Clin Cases. Oct 16, 2017; 5(10): 378-380
Published online Oct 16, 2017. doi: 10.12998/wjcc.v5.i10.378
Published online Oct 16, 2017. doi: 10.12998/wjcc.v5.i10.378
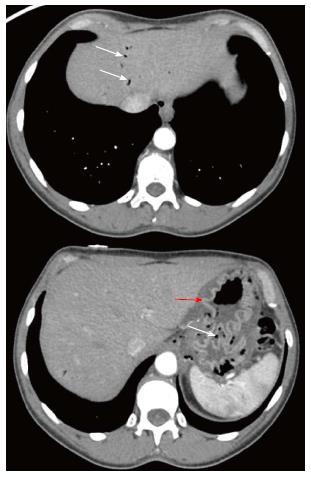
Figure 1 Computed tomography abdomen demonstrating portal venous gas as well as gastric pneumatosis and edema (portal venous gas and gastric pneumatosis noted with white arrows, gastric edema noted with red arrow).
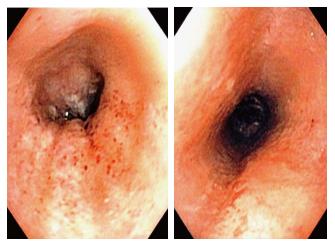
Figure 2 Esophagogastroduodenoscopy demonstrating esophagitis with multiple petechiae and white exudate.
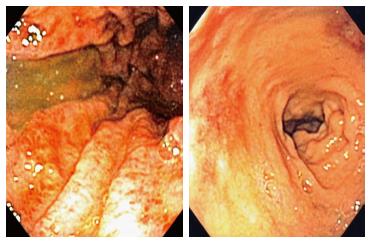
Figure 3 Esophagogastroduodenoscopy demonstrating diffuse gastritis (Left) and areas of duodenitis (Right).
- Citation: Martin JV, Sugawa C. Hydrogen peroxide ingestion with injury to upper gastrointestinal tract. World J Clin Cases 2017; 5(10): 378-380
- URL: https://www.wjgnet.com/2307-8960/full/v5/i10/378.htm
- DOI: https://dx.doi.org/10.12998/wjcc.v5.i10.378


