Copyright
©The Author(s) 2023.
World J Clin Cases. Jul 26, 2023; 11(21): 5023-5034
Published online Jul 26, 2023. doi: 10.12998/wjcc.v11.i21.5023
Published online Jul 26, 2023. doi: 10.12998/wjcc.v11.i21.5023
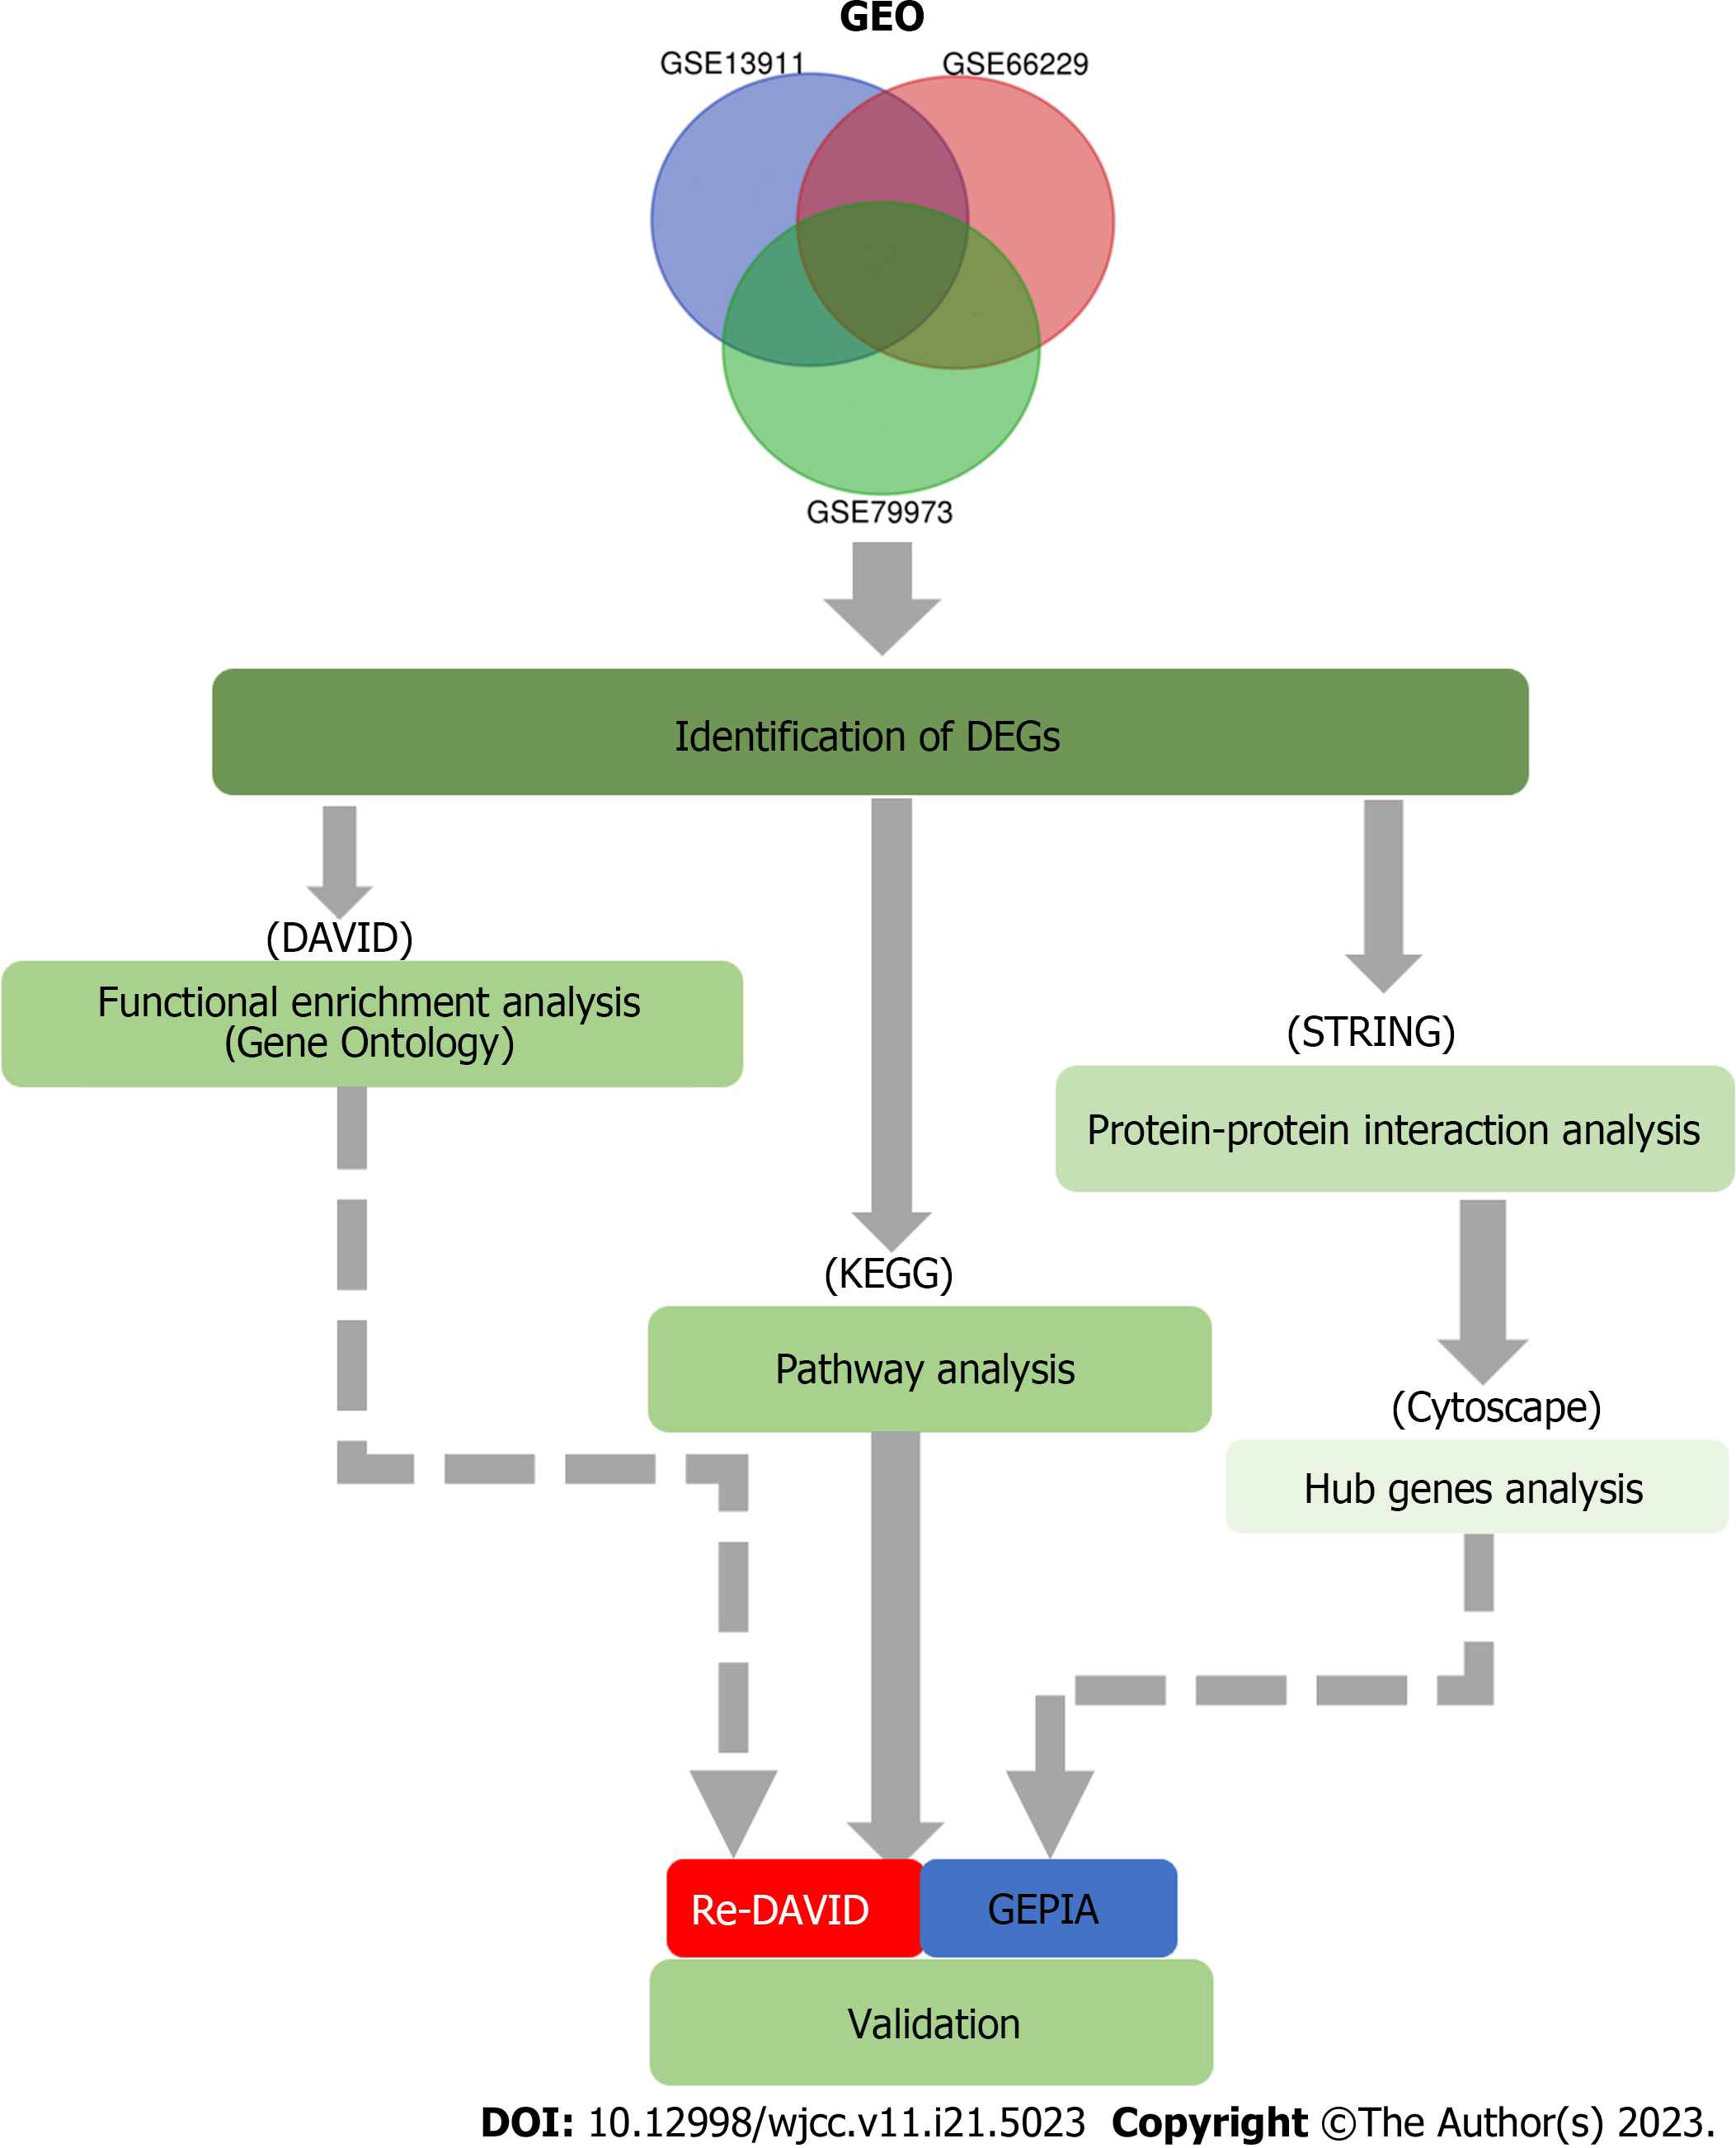
Figure 1 A flow diagram of the present study.
GEO: Gene Expression Omnibus; DEG: Differentially expressed gene; DAVID: Database for Annotation, Visualization, and Integrated Discovery; KEGG: Kyoto Encyclopedia of Genes and Genomes; STRING: Search Tool for the Retrieval of Interacting Genes; GEPIA: Gene Expression Profiling Interactive Analysis.
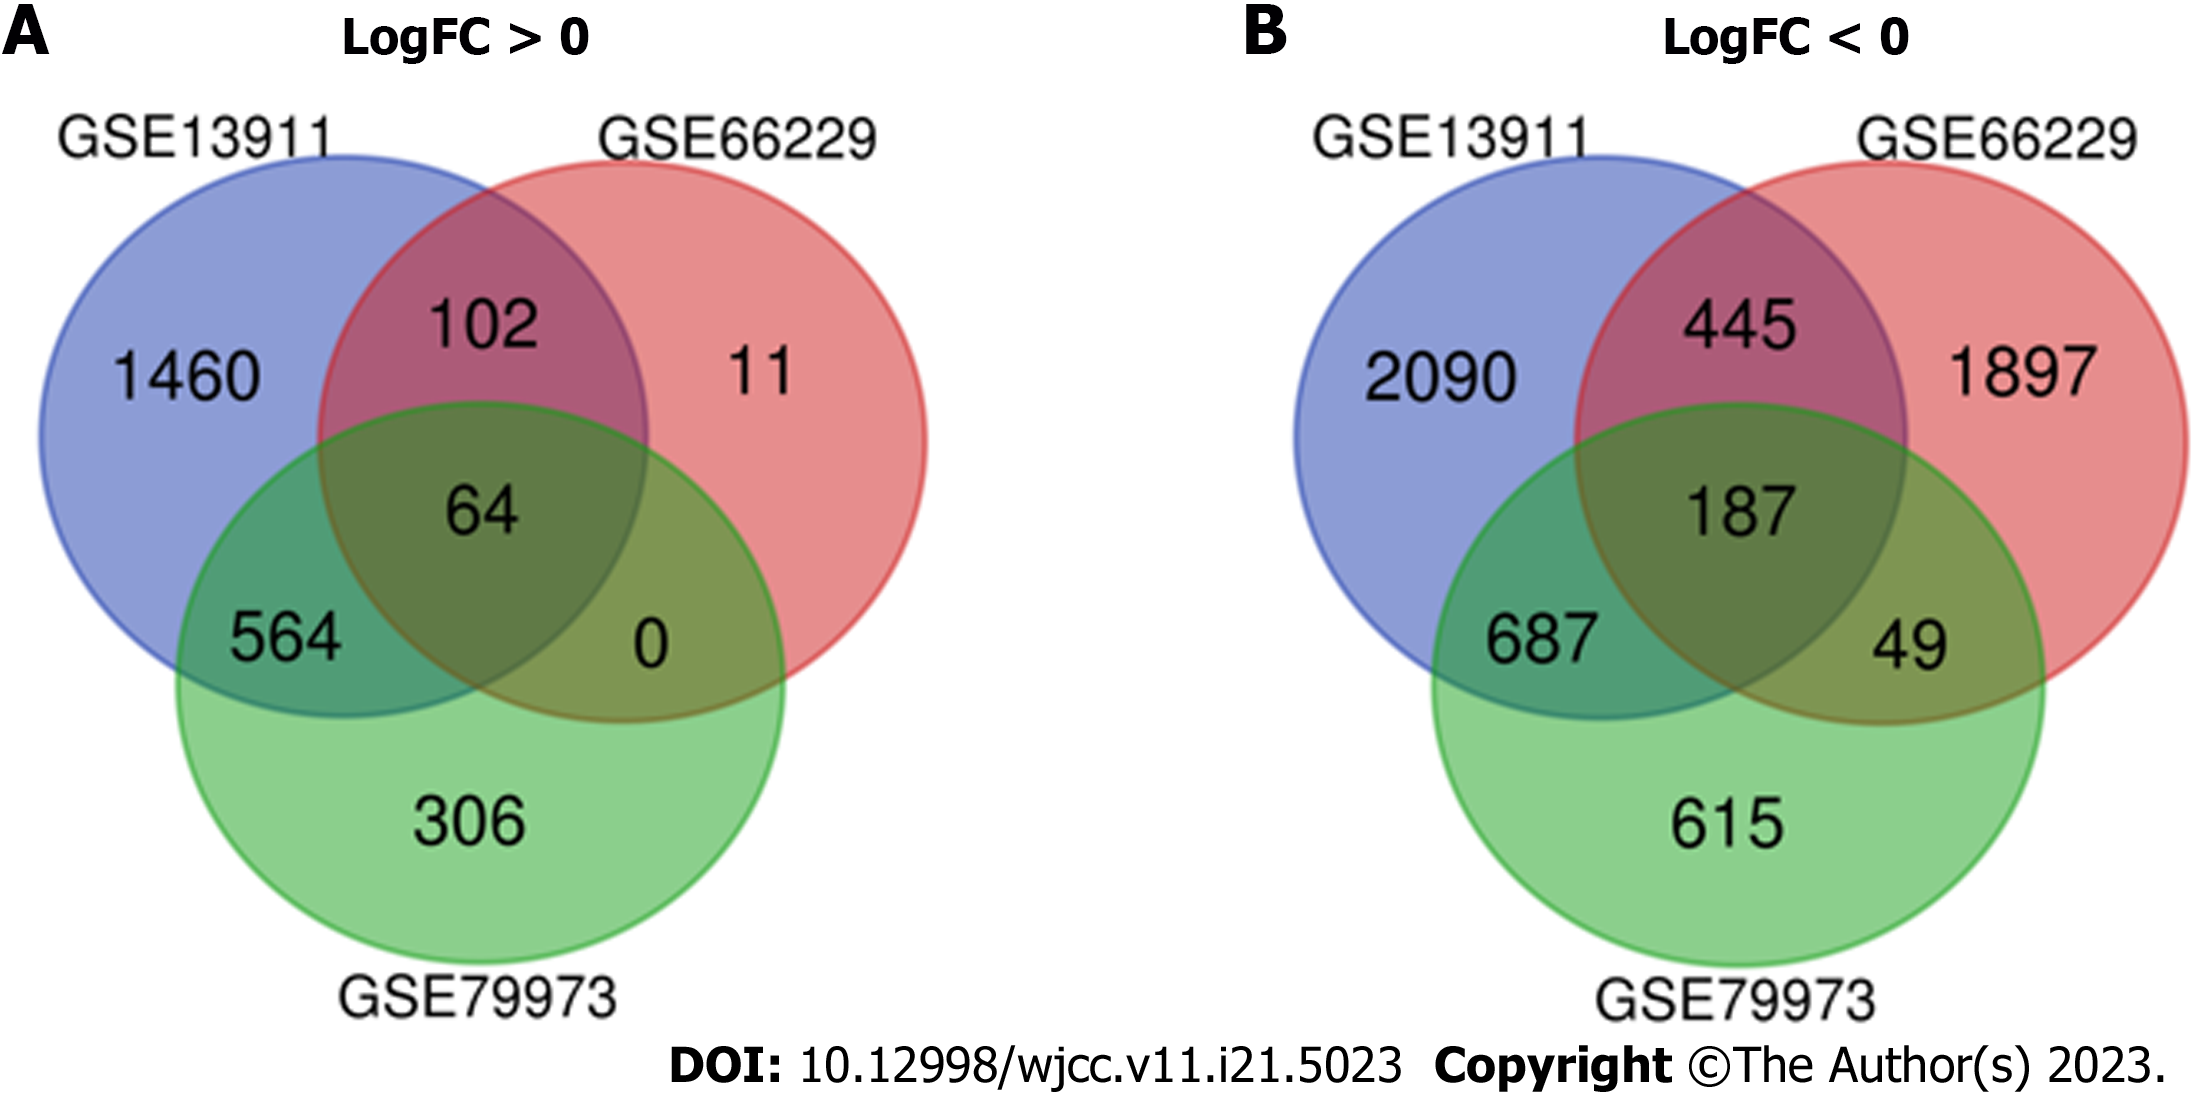
Figure 2 Authentication of 251 common differentially expressed genes in the three datasets (GSE13911, GSE66229, and GSE 79973) through Venn Diagrams software.
Different color represents different datasets. A: Sixty-four differentially expressed genes (DEGs) were upregulated in the three datasets (logFC > 0); B: 187 DEGs were downregulated in the three datasets (logFC < 0). DEGs: Differentially expressed genes. Available online: http://bioinformatics.psb.ugent.be/webtools/Venn/.
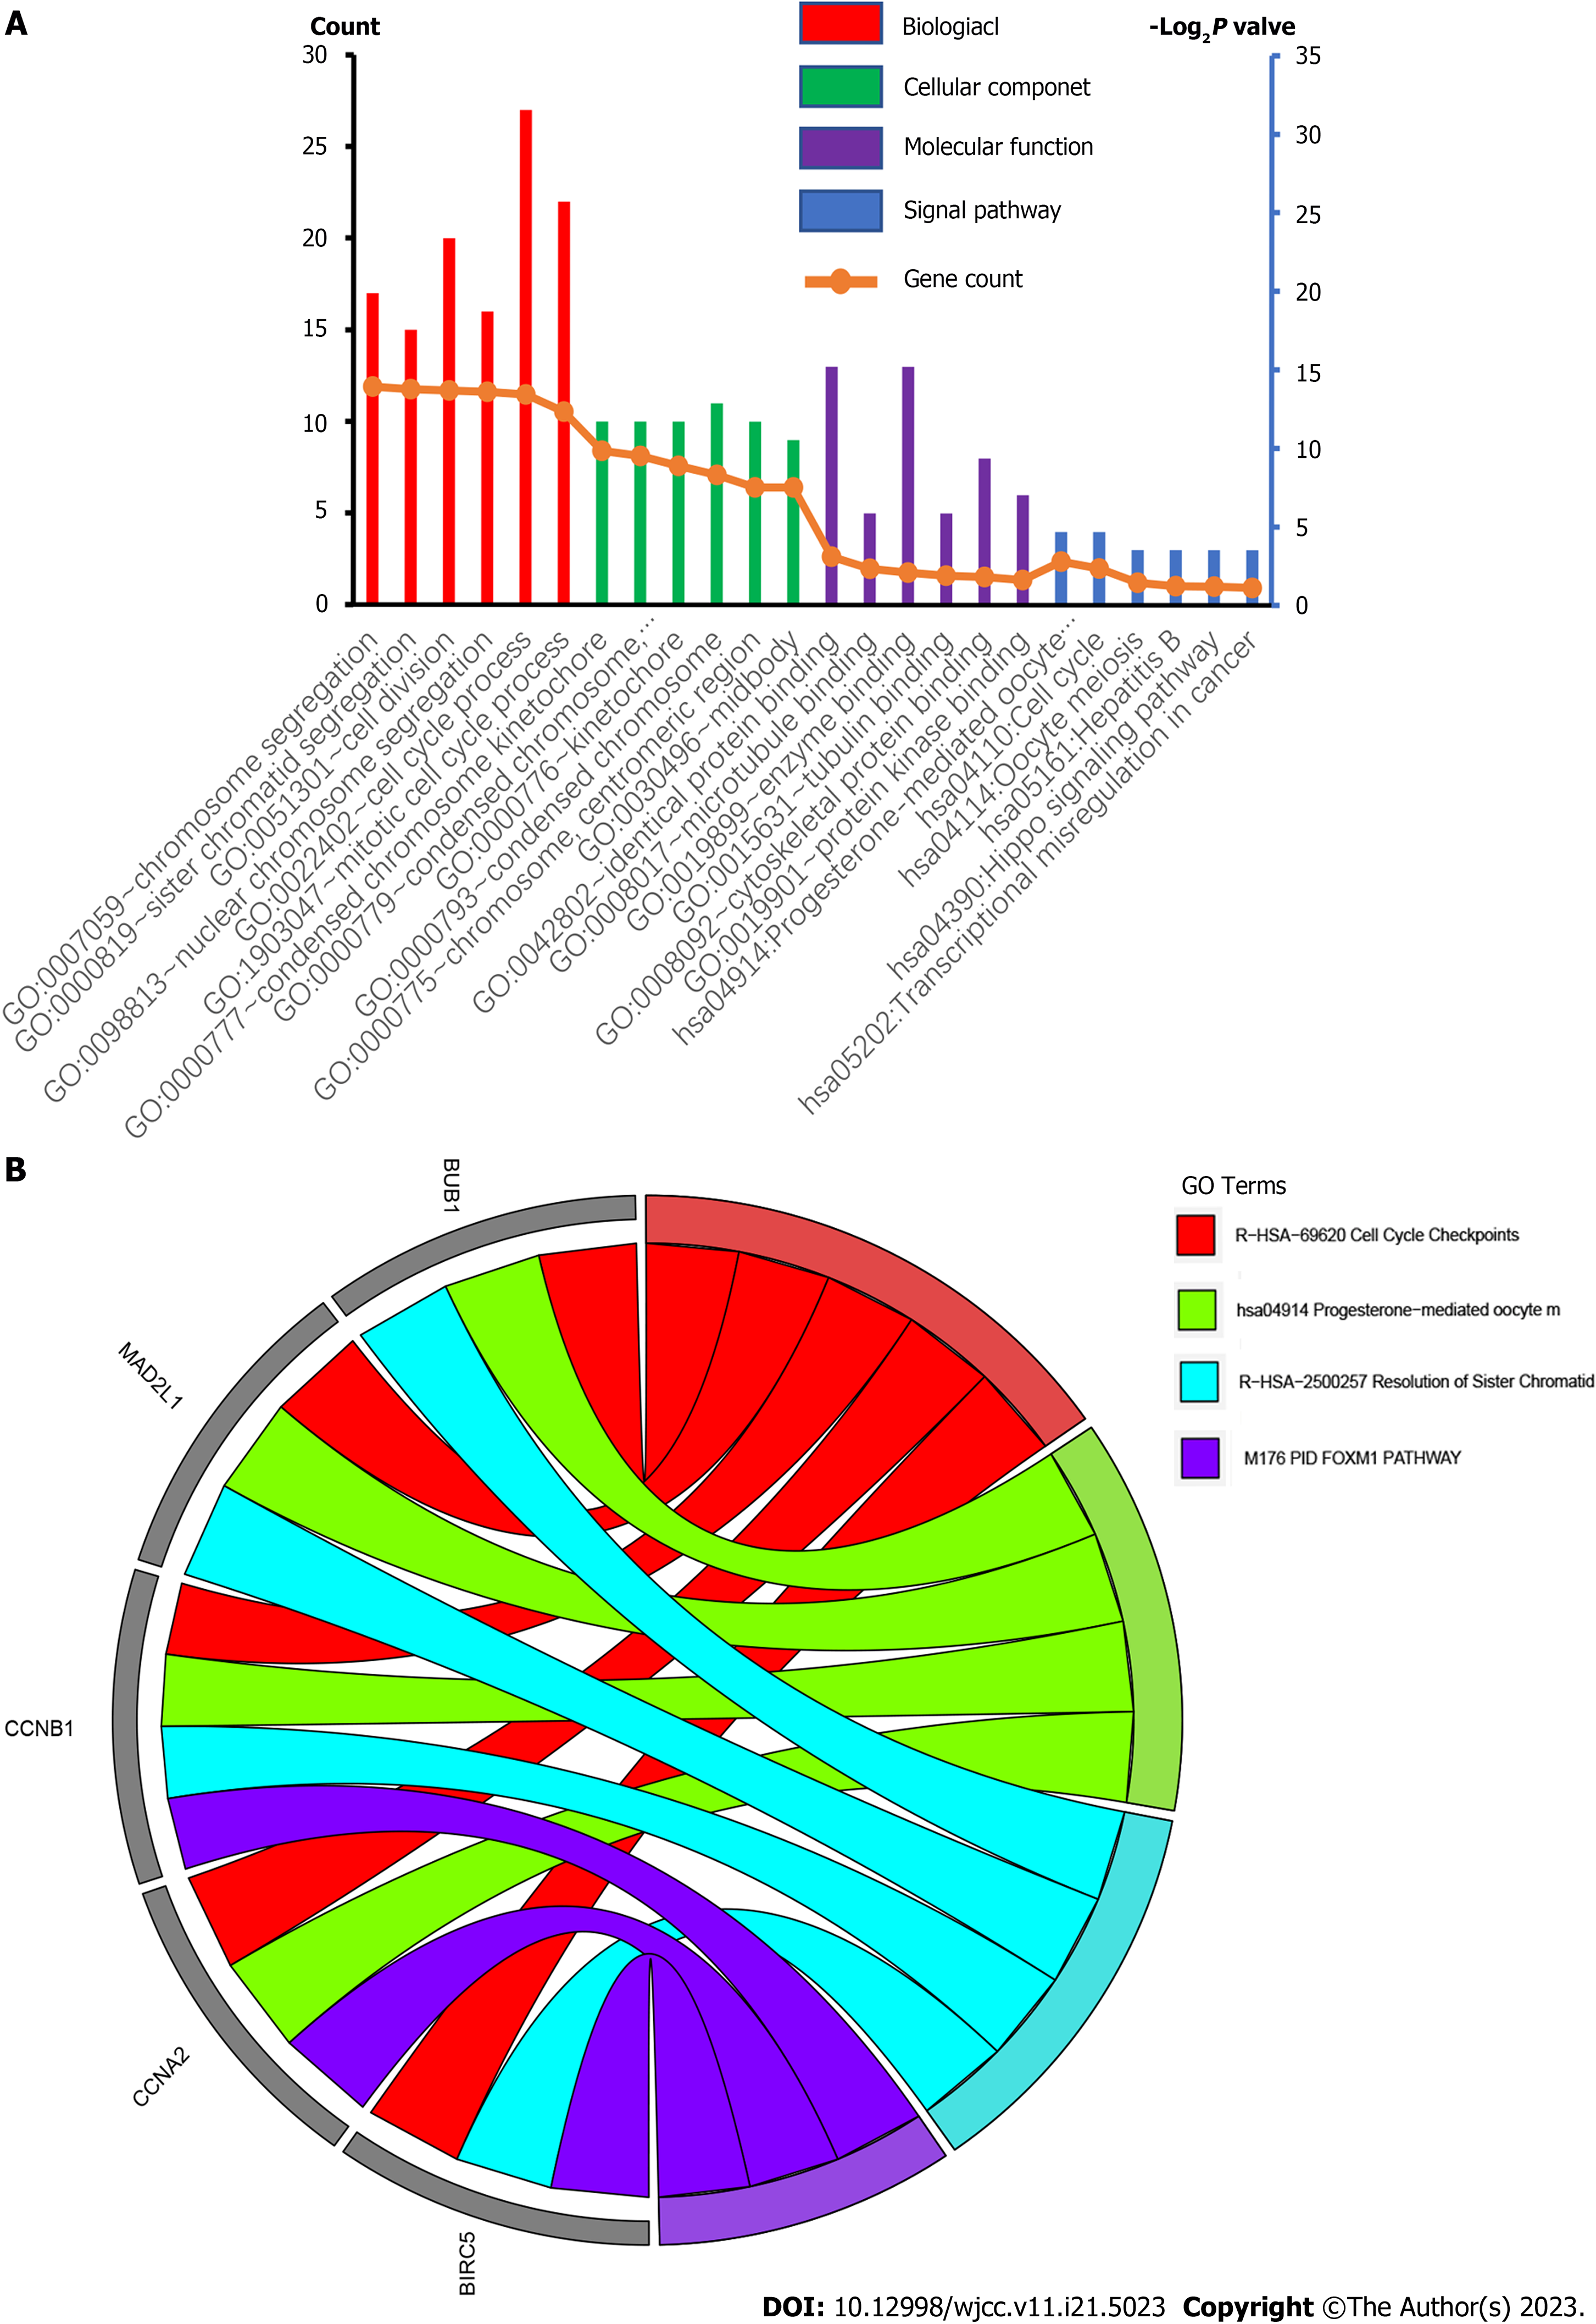
Figure 3 Gene ontology terms and Kyoto Encyclopedia of Genes and Genomes pathways of differentially expressed genes significantly enriched in gastric cancer.
GO: Gene ontology.
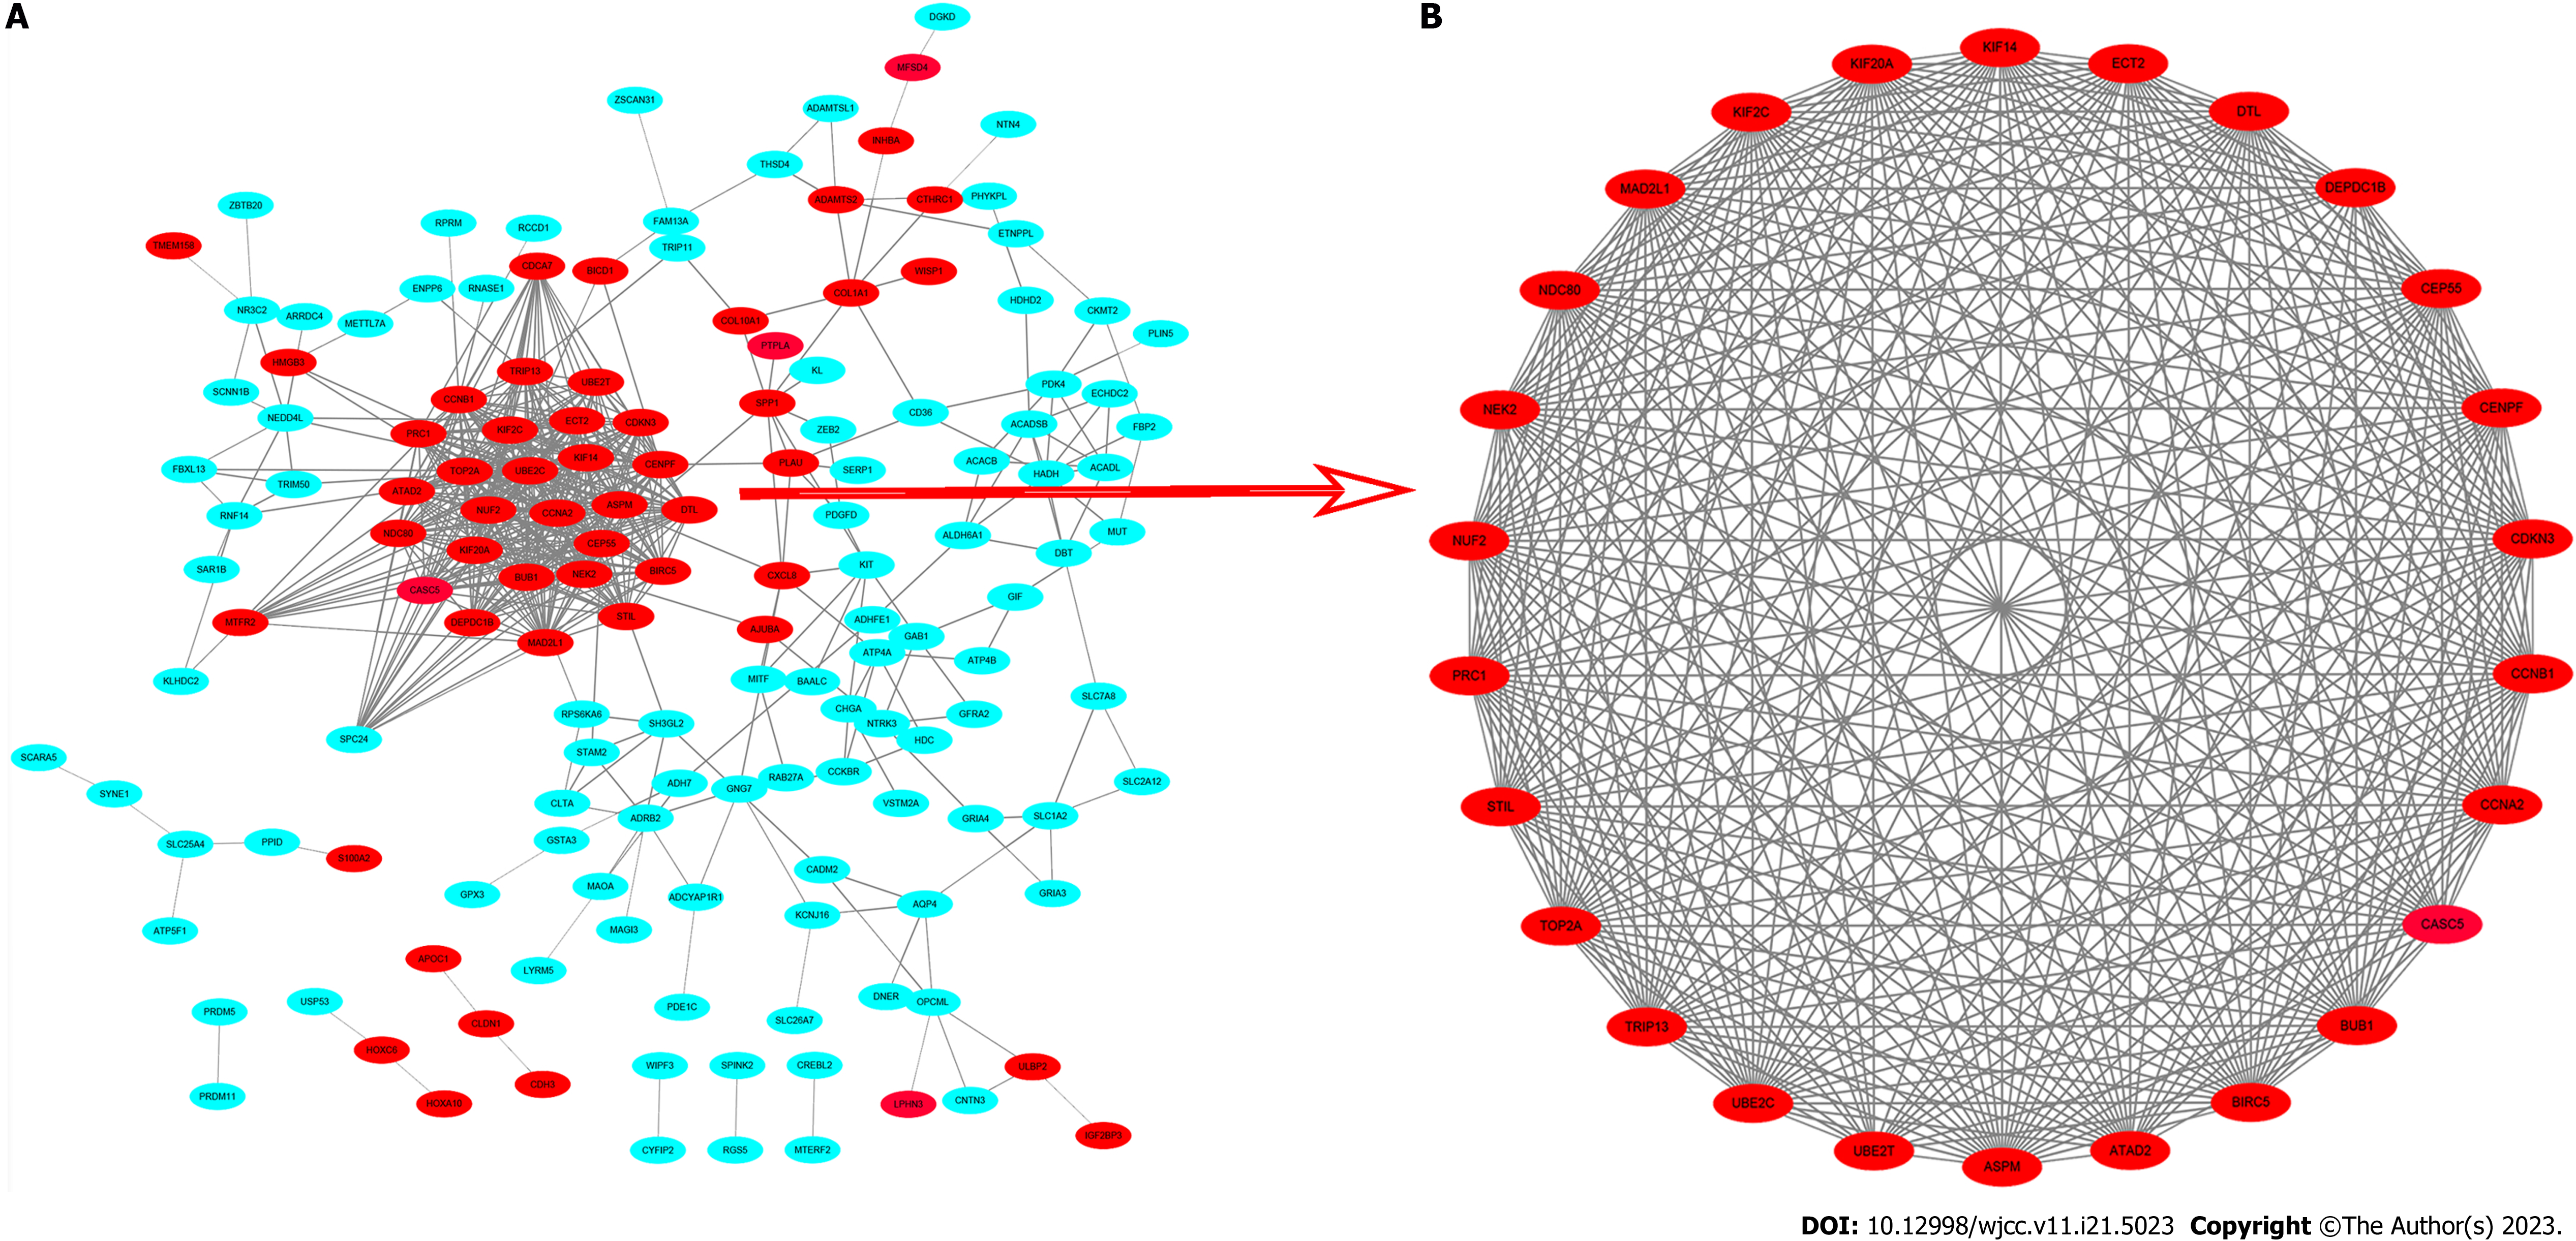
Figure 4 Common differentially expressed genes protein-protein interaction network constructed by Search Tool for the Retrieval of Interacting Genes online database and Module analysis.
A: A total of 251 differentially expressed genes (DEGs) were found in the DEGs protein-protein interaction network complex. The nodes represent proteins; the edges represent the interaction of proteins; green circles represent down-regulated DEGs and red circles represent up-regulated DEGs; B: Module analysis via Cytoscape software. PPI: Protein-protein interaction; STRING: Search Tool for the Retrieval of Interacting Genes.
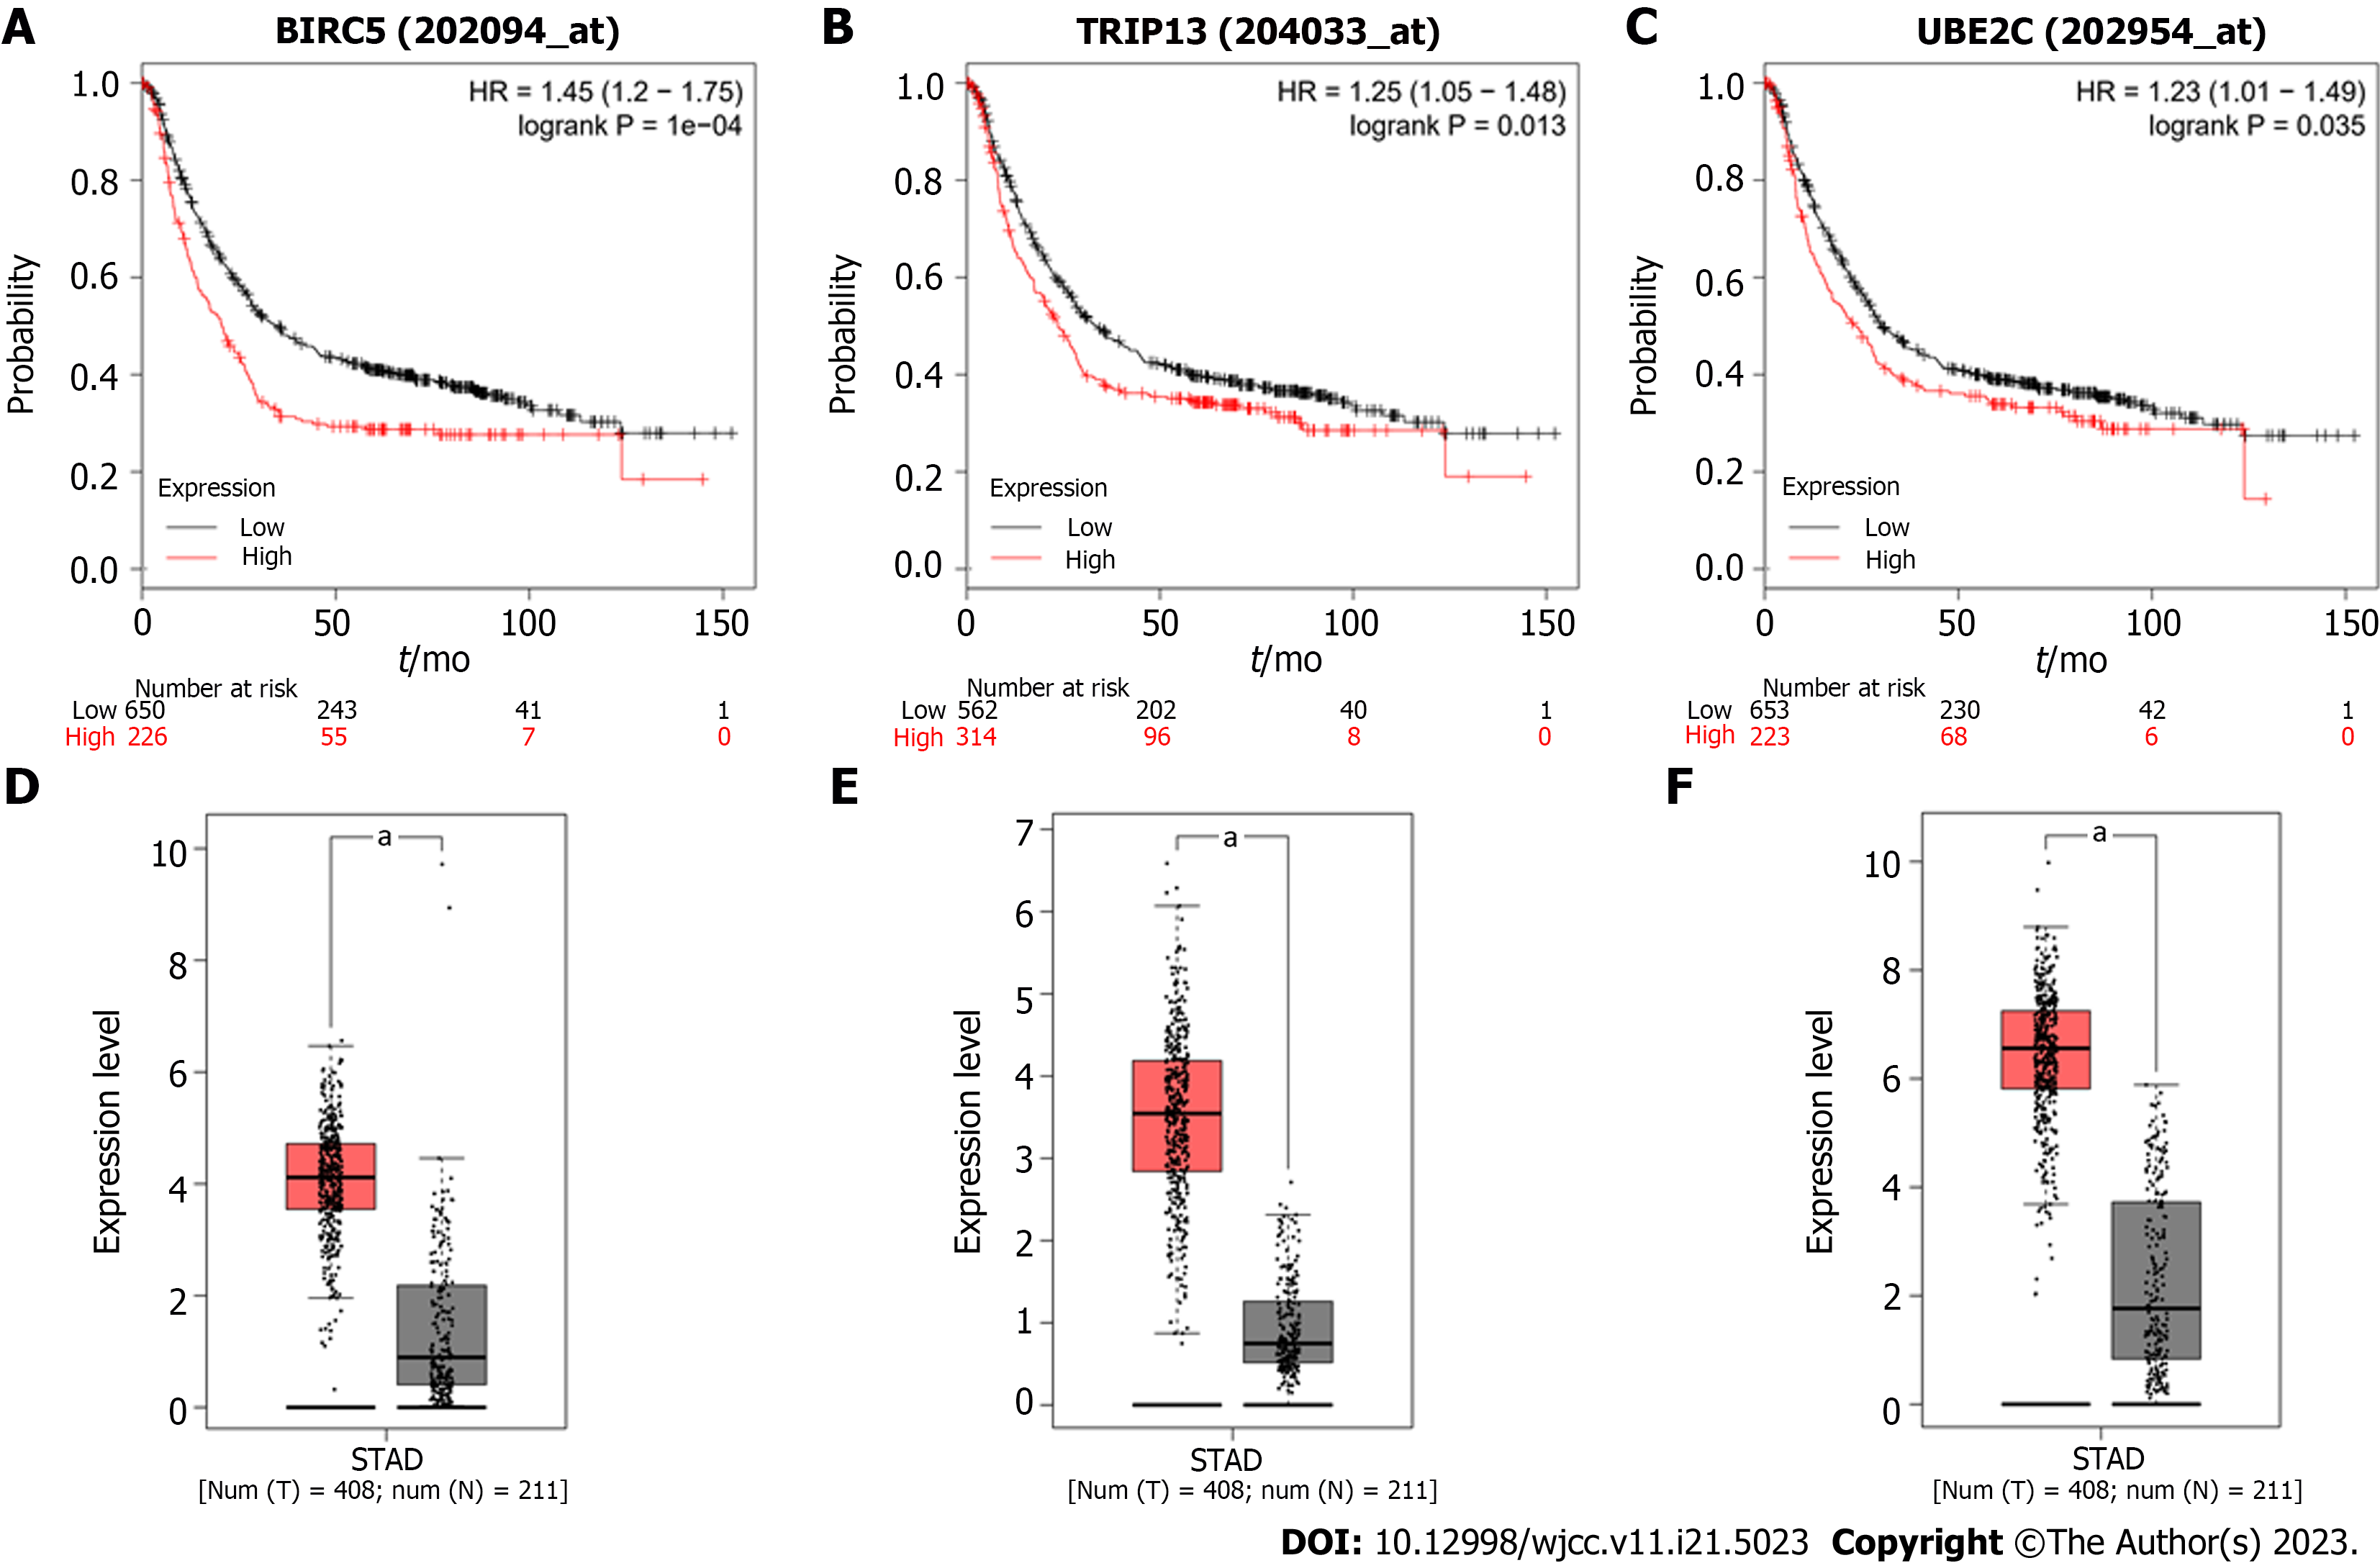
Figure 5 Analysis of BIRC5, TRIP13, and UBE2C genes in patient tissues and the correlation with survival.
A-C: Overall survival of gastric cancer patients with high expression and low expression of BIRC5 (A), TRIP13 (B), and UBE2C (C) genes; D-E: The expression of these genes was analyzed with GEPIA tools. aP < 0.05.
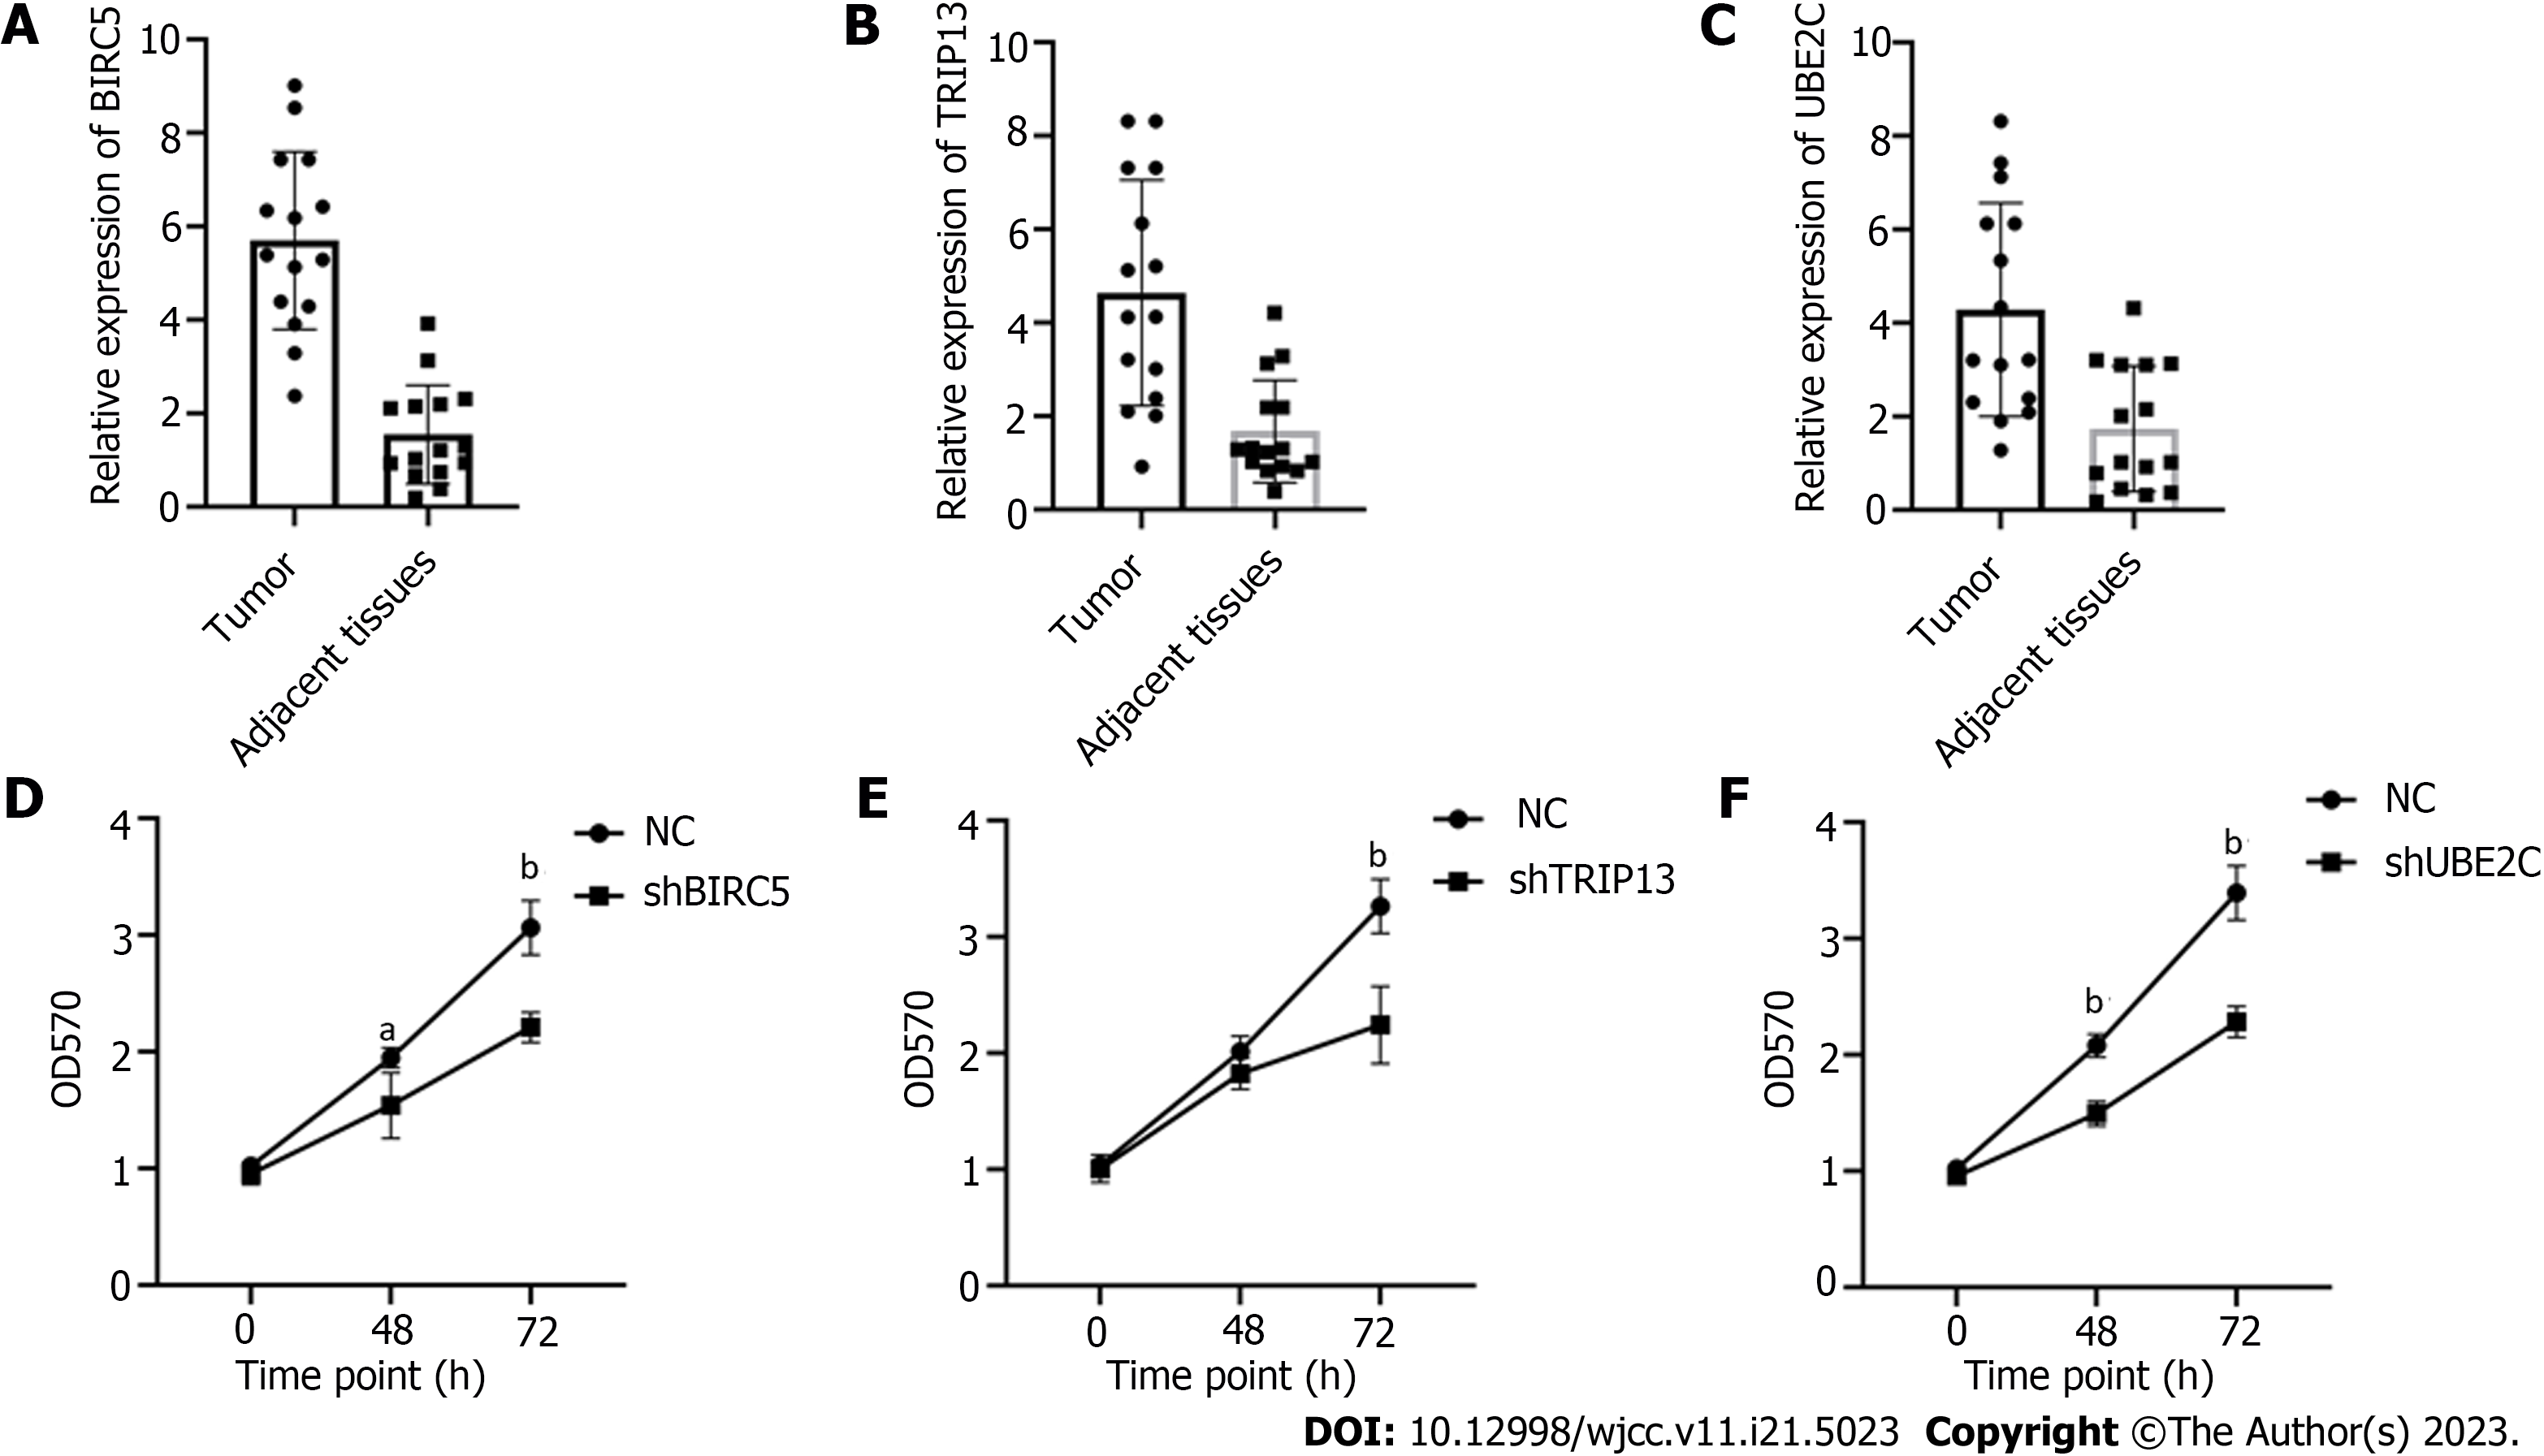
Figure 6 Increased level of BIRC5, TRIP13, and UBE2C genes are related to cell proliferation of gastric cancer cells.
A-C: Expression of BIRC5, TRIP13, and UBE2C genes in 15 pairs of tumor and adjacent normal tissues; D-E: Knockdown of BIRC5, TRIP13, or UBE2C genes significantly suppressed cancer cell proliferation. aP < 0.05; bP < 0.01.
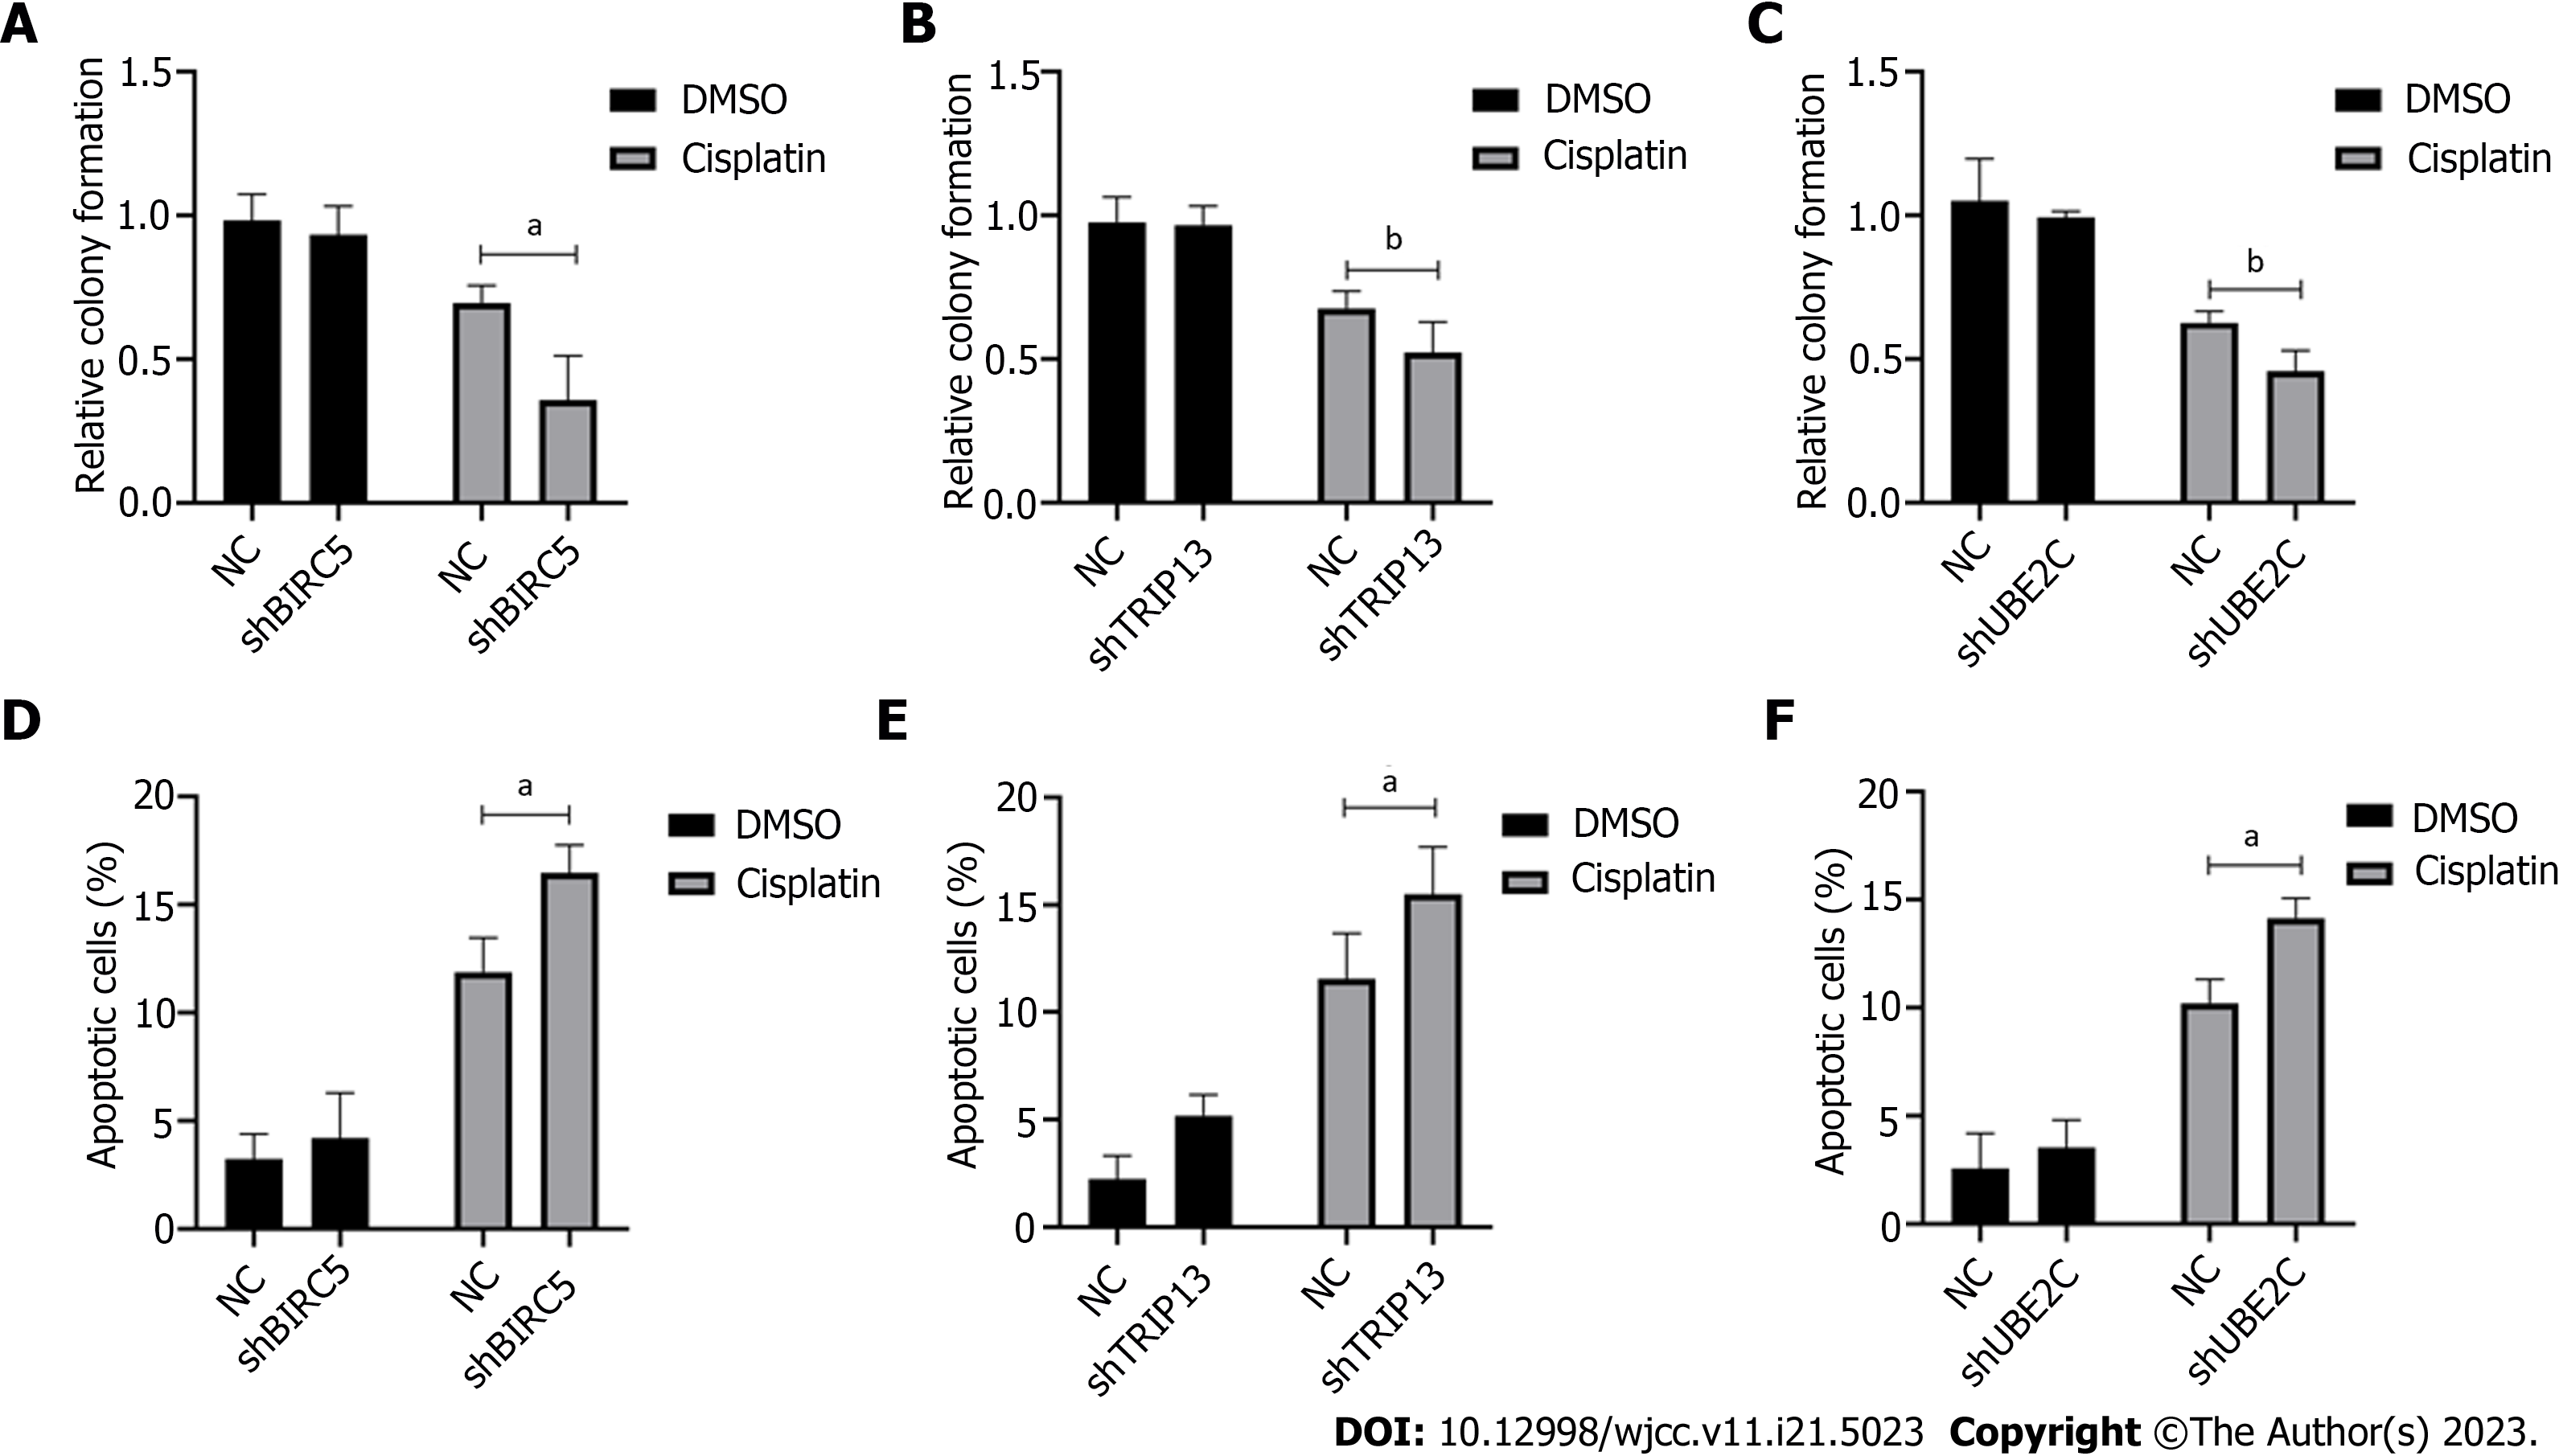
Figure 7 Increased level of BIRC5, TRIP13, and UBE2C genes confers cellular resistance to cisplatin in gastric cancer cells.
A-C: Colony formation assay in cells with shRNA transfected targeting BIRC5, TRIP13, or UBE2C genes; D-F: Cell apoptosis was detected in BIRC5, TRIP13, and UBE2C knockdown cells after treatment with cisplatin. aP < 0.05; bP < 0.01.
- Citation: Yu K, Zhang D, Yao Q, Pan X, Wang G, Qian HY, Xiao Y, Chen Q, Mei K. Identification of functional genes regulating gastric cancer progression using integrated bioinformatics analysis. World J Clin Cases 2023; 11(21): 5023-5034
- URL: https://www.wjgnet.com/2307-8960/full/v11/i21/5023.htm
- DOI: https://dx.doi.org/10.12998/wjcc.v11.i21.5023


