Copyright
©The Author(s) 2023.
World J Clin Cases. Jan 6, 2023; 11(1): 127-134
Published online Jan 6, 2023. doi: 10.12998/wjcc.v11.i1.127
Published online Jan 6, 2023. doi: 10.12998/wjcc.v11.i1.127
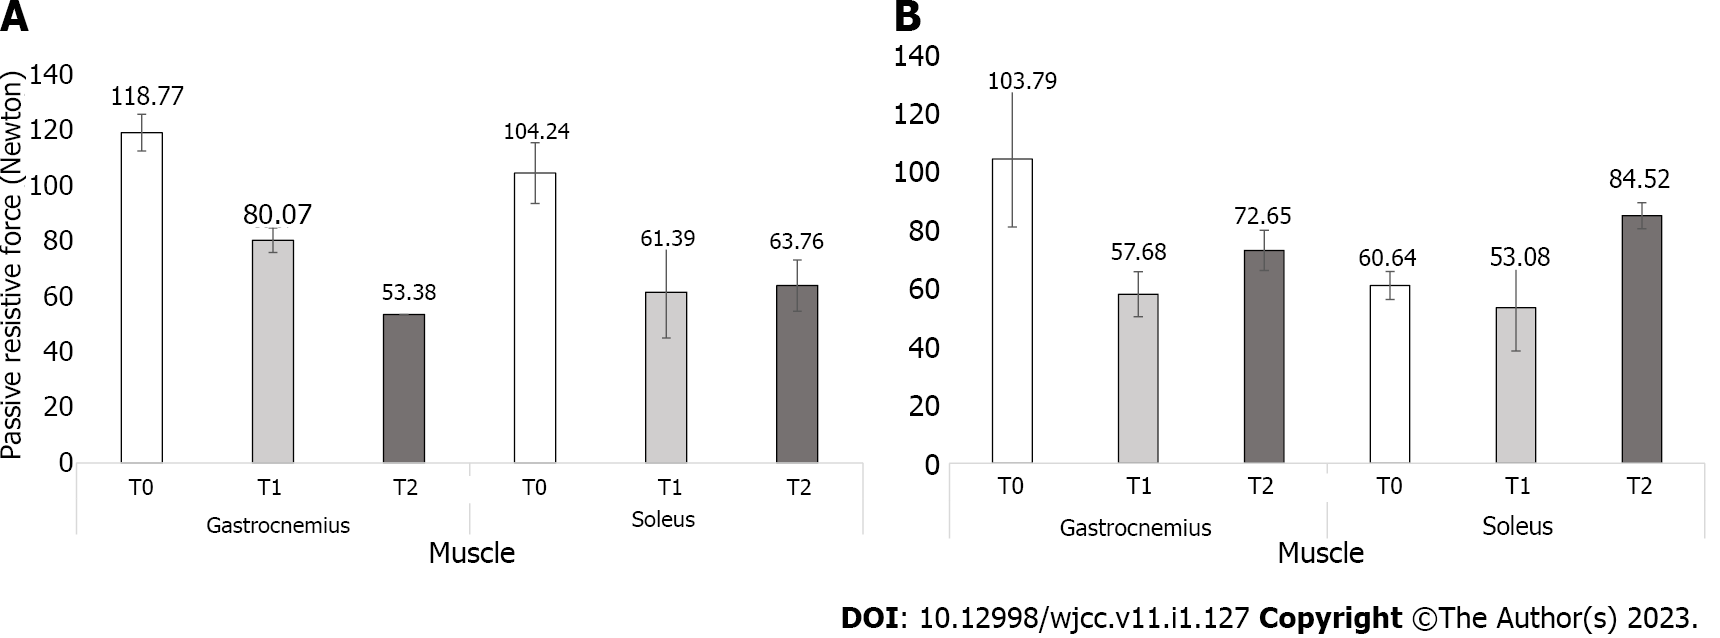
Figure 1 Bar chart.
Mean differences of passive resistive force (Newton) at baseline (T0), post-treatment (T1) and 1 wk follow-up (T2) measured with the hand-held dynamometer. A: Low velocity (3 s); and B: Fast velocity (1 s) in gastrocnemius and soleus muscles.
- Citation: Comino-Suárez N, Gómez-Soriano J, Ceruelo-Abajo S, Vargas-Baquero E, Esclarín A, Avendaño-Coy J. Extracorporeal shock wave for plantar flexor spasticity in spinal cord injury: A case report and review of literature. World J Clin Cases 2023; 11(1): 127-134
- URL: https://www.wjgnet.com/2307-8960/full/v11/i1/127.htm
- DOI: https://dx.doi.org/10.12998/wjcc.v11.i1.127


