Copyright
©The Author(s) 2022.
World J Clin Cases. Jan 21, 2022; 10(3): 939-953
Published online Jan 21, 2022. doi: 10.12998/wjcc.v10.i3.939
Published online Jan 21, 2022. doi: 10.12998/wjcc.v10.i3.939
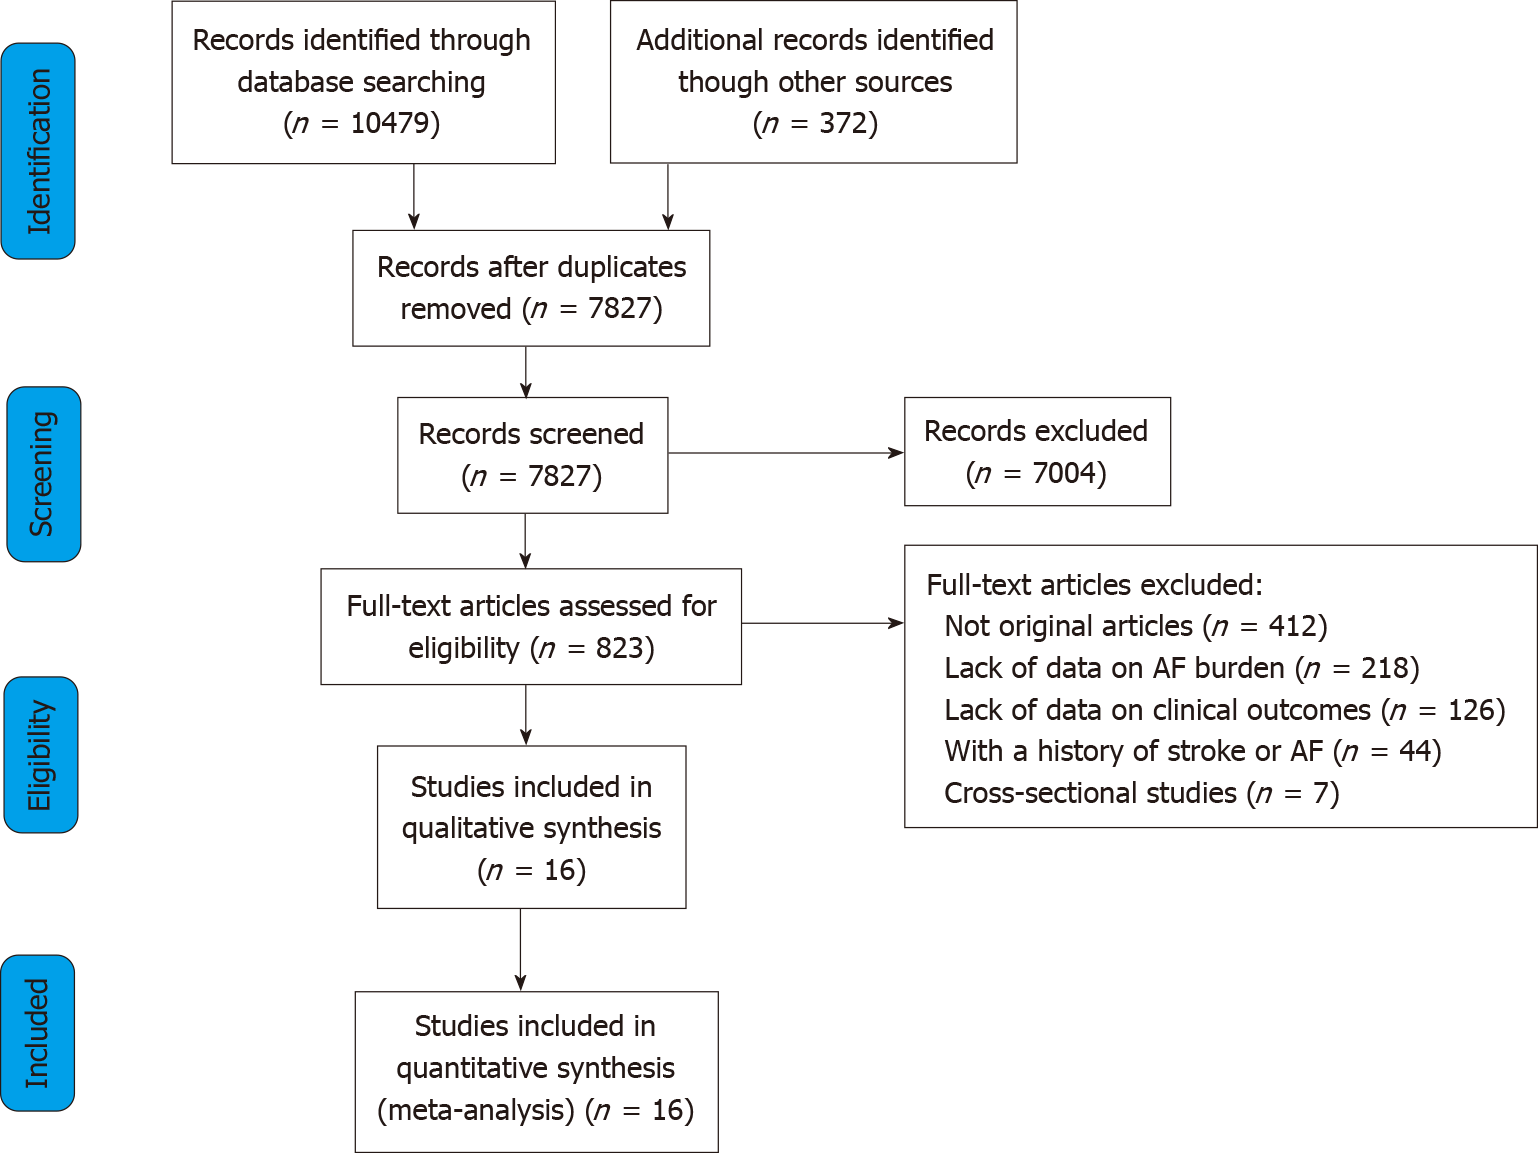
Figure 1 Flow diagram of the study selection process.
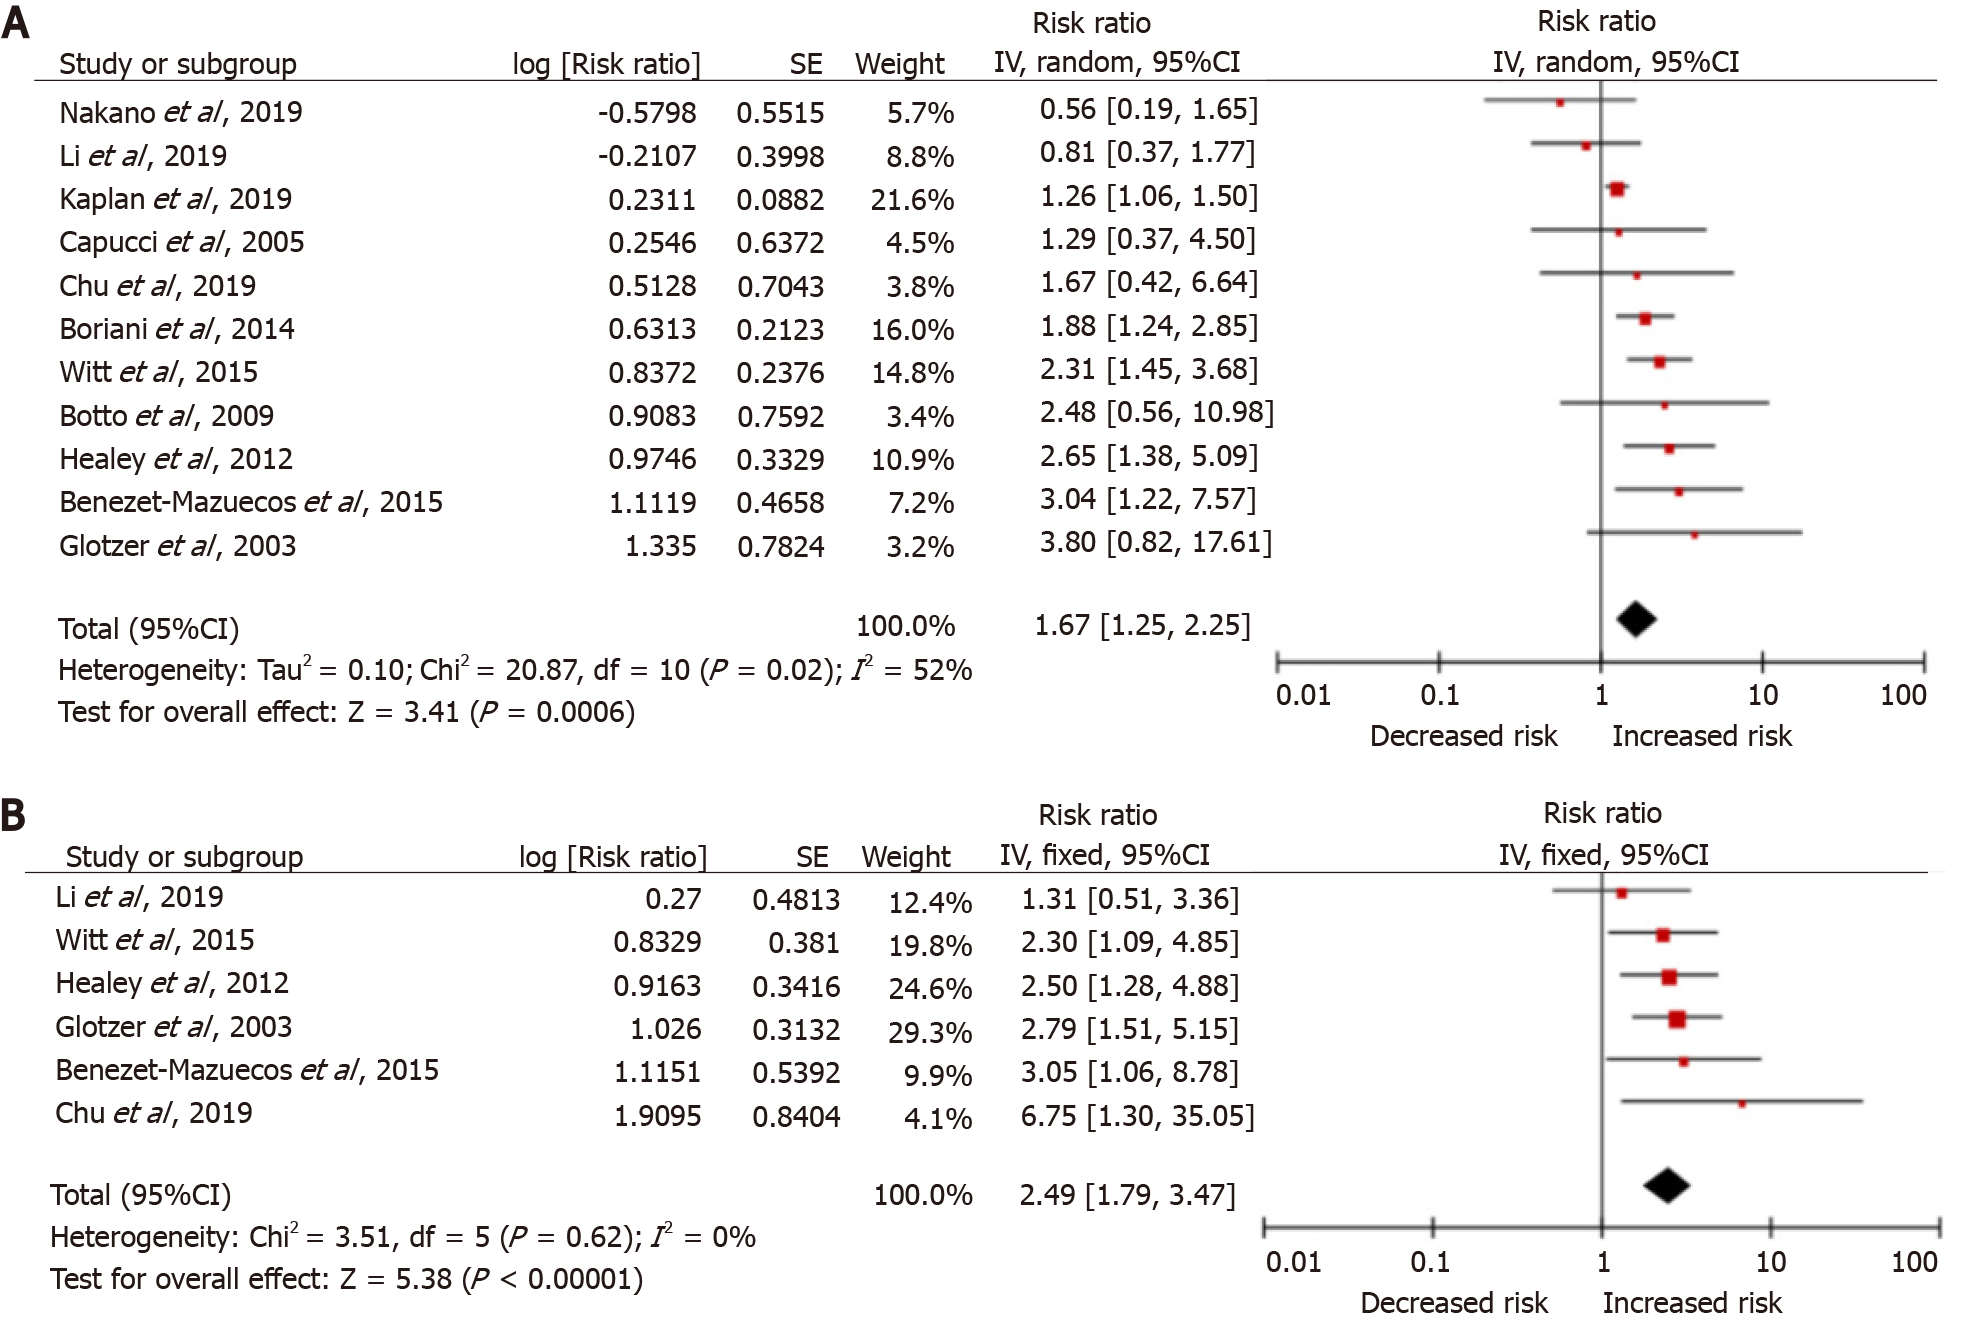
Figure 2 Meta-analysis forest plot: Atrial fibrillation burden and the risk of future stroke.
A: Crude risk ratio (RR) model; B: Adjusted RR model; SE: Stand error; CI: Confidence interval.
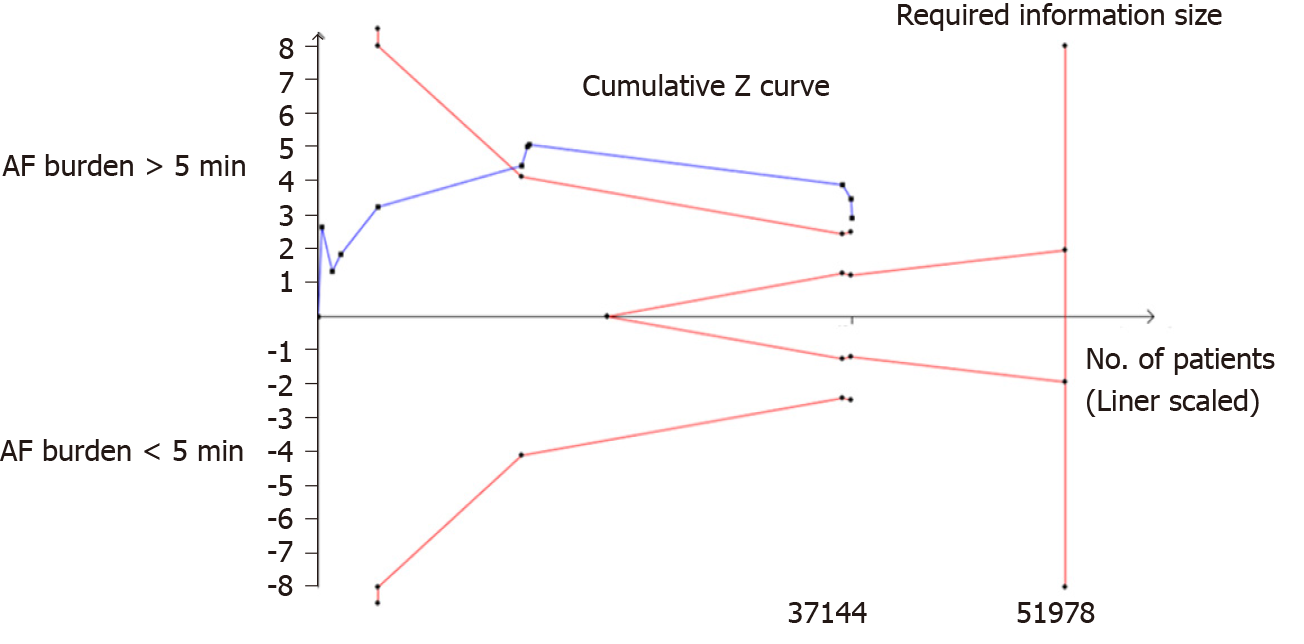
Figure 3 Trial sequential analysis of atrial fibrillation burden > 5 min.
Heterogeneity adjusted required information size of 51978 participants calculated on basis of incidence of 2.37% in control group, relative risk reduction of 30%, α = 5%, β = 20%, and I2 = 30%. Actually, accrued number of participants was 37144, 71.5% of required information size. AF: Atrial fibrillation.
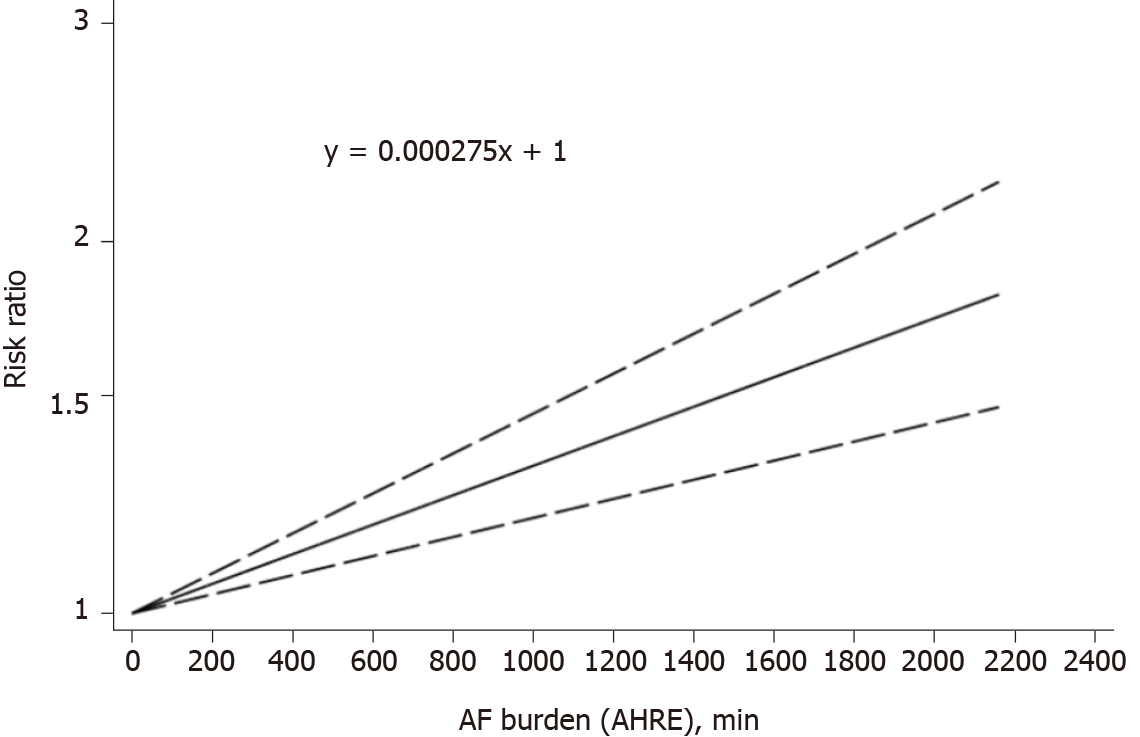
Figure 4 Random-effects liner dose-response association between atrial fibrillation burden and the risk future stroke (Pnonlinear = 0.
656). AF: Atrial fibrillation.
Figure 5 Adjusted risk ratio meta-analysis forest plot: Atrial fibrillation burden and the risk of clinical atrial fibrillation.
SE: stand error; CI: confidence interval.
Figure 6 Adjusted risk ratio meta-analysis forest plot: Atrial fibrillation burden and the risk of all-cause mortality.
SE: Stand error; CI: Confidence interval.
- Citation: Yang SY, Huang M, Wang AL, Ge G, Ma M, Zhi H, Wang LN. Atrial fibrillation burden and the risk of stroke: A systematic review and dose-response meta-analysis. World J Clin Cases 2022; 10(3): 939-953
- URL: https://www.wjgnet.com/2307-8960/full/v10/i3/939.htm
- DOI: https://dx.doi.org/10.12998/wjcc.v10.i3.939


