Copyright
©The Author(s) 2022.
World J Clin Cases. Aug 6, 2022; 10(22): 7794-7807
Published online Aug 6, 2022. doi: 10.12998/wjcc.v10.i22.7794
Published online Aug 6, 2022. doi: 10.12998/wjcc.v10.i22.7794
Figure 1 Bland-Altman plot, scatterplot.
A: All individual measurements FreeStyle Libre vs HemoCue; B: All individual measurements Dexcom G5 vs HemoCue. Thick dotted line represents the mean difference.
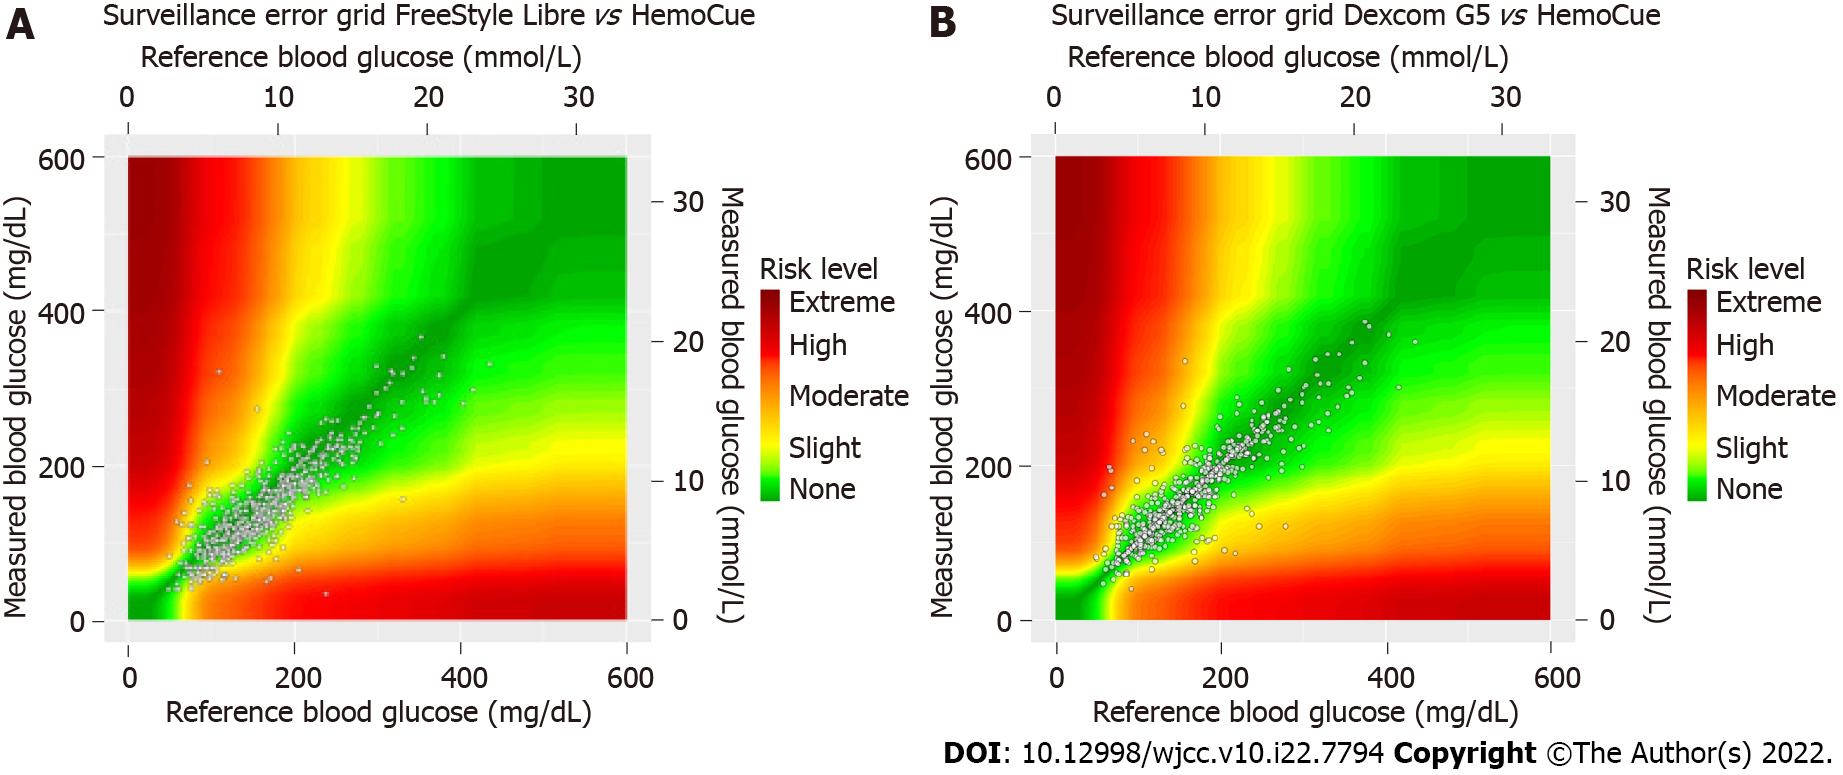
Figure 2 Surveillance error grid.
A: FreeStyle Libre vs HemoCue -66.3% of values fall within the dark green area; B: Dexcom G5 vs HemoCue -82% of values fall within the dark green area.
- Citation: Ólafsdóttir AF, Andelin M, Saeed A, Sofizadeh S, Hamoodi H, Jansson PA, Lind M. Performance of Dexcom G5 and FreeStyle Libre sensors tested simultaneously in people with type 1 or 2 diabetes and advanced chronic kidney disease. World J Clin Cases 2022; 10(22): 7794-7807
- URL: https://www.wjgnet.com/2307-8960/full/v10/i22/7794.htm
- DOI: https://dx.doi.org/10.12998/wjcc.v10.i22.7794


