Copyright
©The Author(s) 2022.
World J Clin Cases. May 6, 2022; 10(13): 4273-4279
Published online May 6, 2022. doi: 10.12998/wjcc.v10.i13.4273
Published online May 6, 2022. doi: 10.12998/wjcc.v10.i13.4273
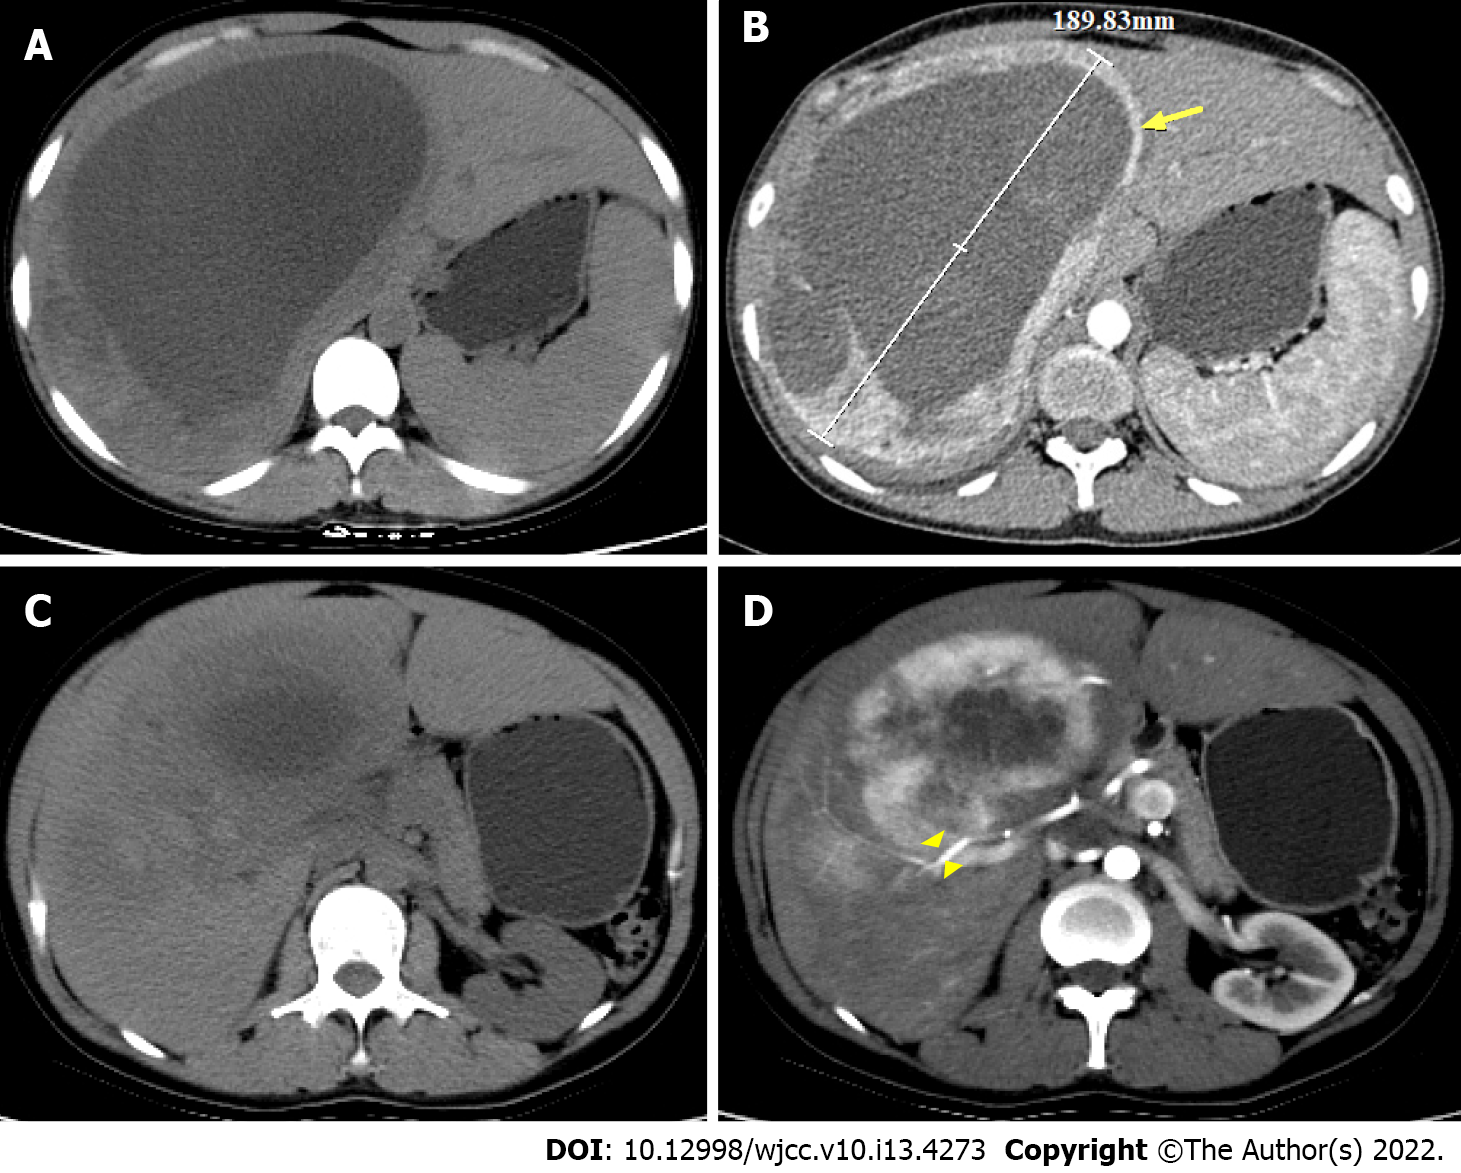
Figure 1 Abdominal computed tomography scan findings (axial).
A-C: Large oval cystic solid space-occupying lesion, maximum diameter was approximately 18.9 cm in S7 and S8 segments of the liver; B and D: Solid component of the tumor (arrow) in arterial phase showing heterogeneous and marked enhancement, the cystic components had no obvious enhancement effect, with penetration by hepatic artery branches figure (arrowhead).
Figure 2 Postoperative pathological findings.
A: Most of tumor cells were epithelioid, with round ovoid nuclei, abundant cytoplasm, and eosinophil-rich tumor cells in radial rows around blood vessels, HE × 400; B: HMB45 positive; C: Melan-A positive; D: Smooth muscle actin positive immunohistochemistry × 200.
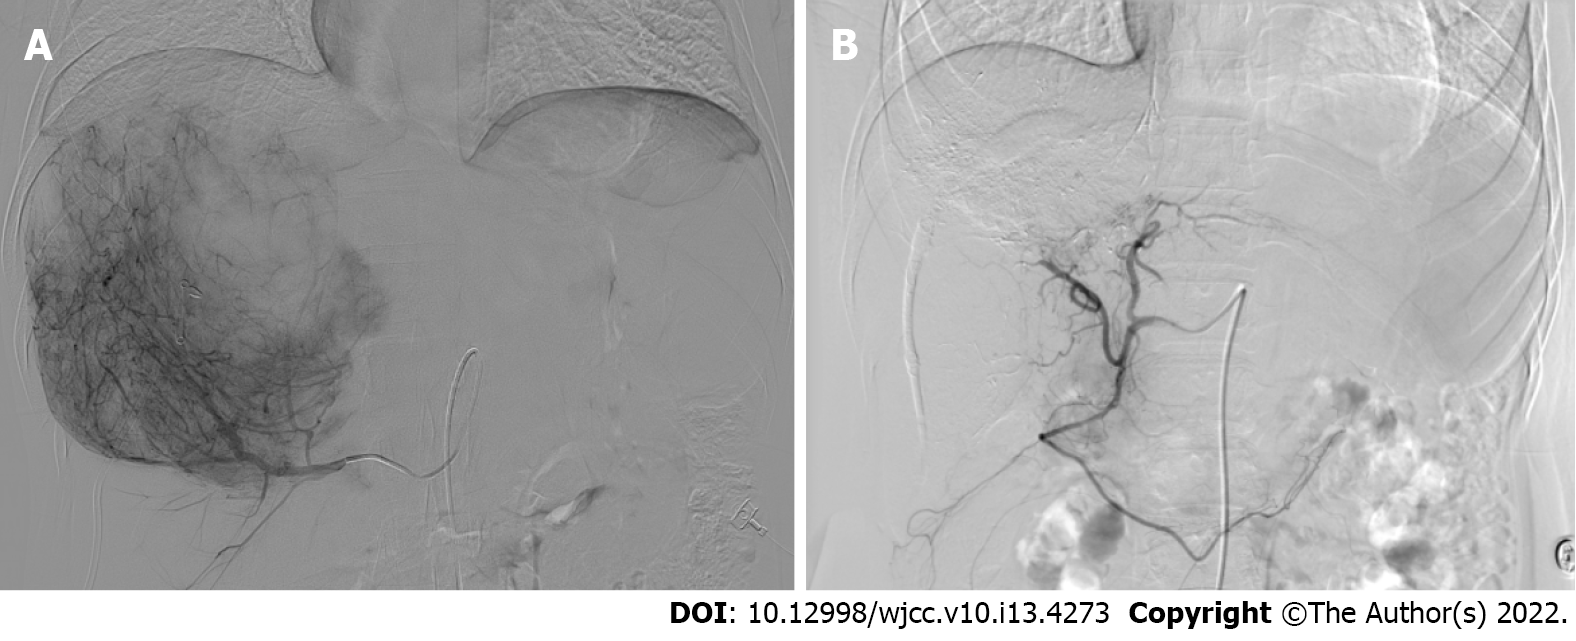
Figure 3 Comparison of digital subtraction angiography before and after treatment with transarterial embolization combined with sorafenib.
A: Positive staining of giant tumor in right lobe of the liver before treatment, suggesting an abundant blood supply; B: Disappearance of tumor staining after treatment.
Figure 4 Results of enhanced computed tomography (Sagittal plane) examination of the abdomen during transarterial embolization combined with sorafenib treatment.
Four transarterial embolizations were performed, the lesions were smaller than before, the area of iodine oil increased, and most of the tumors were non-viable. A: Before treatment; B: 1st; C: 2nd; D: 3rd; E: 4th.
Figure 5 Enhancement computed tomography images.
The tumor volume decreased and lipiodol still showed diffuse dense deposition on abdominal computed tomography axial (A) and sagittal (B) images during reexamination after cessation of treatment.
- Citation: Li YF, Wang L, Xie YJ. Hepatic perivascular epithelioid cell tumor: A case report. World J Clin Cases 2022; 10(13): 4273-4279
- URL: https://www.wjgnet.com/2307-8960/full/v10/i13/4273.htm
- DOI: https://dx.doi.org/10.12998/wjcc.v10.i13.4273


